Results for
Dear MATLAB contest enthusiasts,
In the 2023 MATLAB Mini Hack Contest, Tim Marston captivated everyone with his incredible animations, showcasing both creativity and skill, ultimately earning him the 1st prize.
We had the pleasure of interviewing Tim to delve into his inspiring story. You can read the full interview on MathWorks Blogs: Community Q&A – Tim Marston.
Last question: Are you ready for this year’s Mini Hack contest?
It's been over six years since I've written any serious MATLAB code, so I thought it would be fun to see how easily ChatGPT could help me out. While others have probably already used ChatGPT to generate MATLAB code, I didn't find any evidence of it when I searched through the ThingSpeak forum. That inspired me to post an example to get people thinking about it.
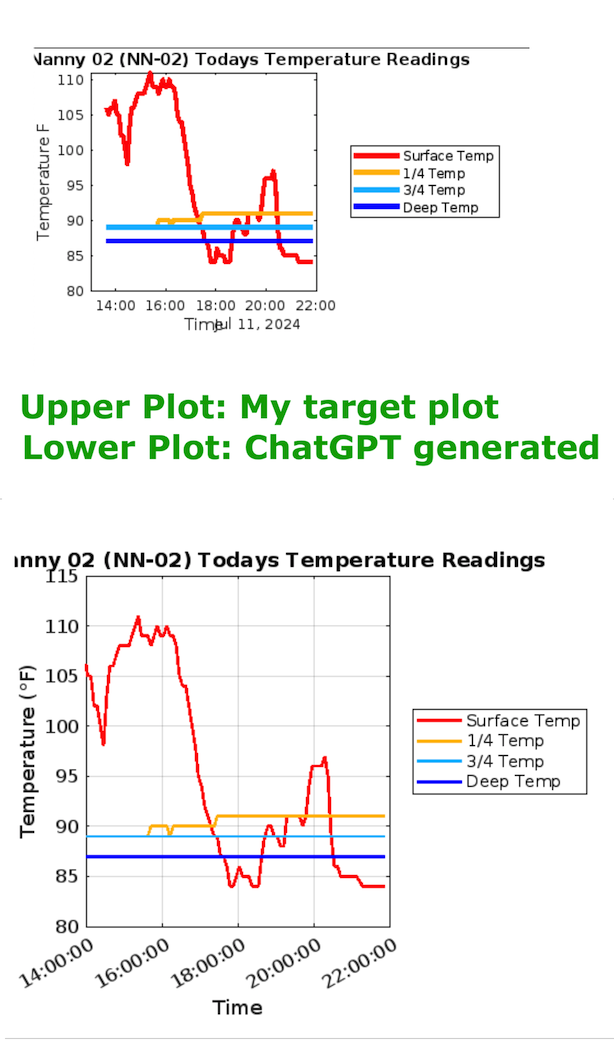
This example reads four temperature fields from the same channel and plots them on a single graph.
My ChatGPT prompt:
The prompt is pretty straightforward and essentially walks through all the elements of the chart that I wanted. It's also important to consider any filtering or "data cleansing" that should be done. Since this was my first time doing this, I decided to use an existing plot I was already familiar with as my "target state".
The prompt: "I would like you to generate some MATLAB code to create what is called a MATLAB Visualization. Its purpose will be to generate a chart of 4 fields found in a ThingSpeak channel. The ThingSpeak channel name is "Nest Nanny 2 (NN-02)" and its channel id (needed for the code) is xxxxxxx. The read api key is XXXXXXXXXXXXXXXX. The chart title should be "Nest Nanny 02 (NN-02) Todays Temperature Readings" It should plot data from 4 fields (field 3 - 6) who's names are "Surface Temp", "1/4 Temp", "3/4 Temp", and "Deep Temp". I would like the plot lines for these 4 fields to be different colors (red, orange, cyan, and blue) but on the same chart. I would like Temperature in Fahrenheit to be on the Y axis and Time on the x axis. I would like it to display the last 100 data points. I'd like to use this colororder. colororder(["#FF0000","#FFBB00","#00BBFF", "#0000FF"]) I would like the legend to be to the right of the chart, not contained within the chart. No temperature data should have a value of 50 or less and we can assume it's a sensor issue when this is observed. If a data value is 50 or less, use the value of it's nearest (in the time series) non-zero, non-negative value for that field. The data is stored in the channel as Fahrenheit and does not need to be converted from Celsius. "
Because I did this exercise using an existing plot and had a clear objective in mind, it was relatively quick to iterate four or five times with ChatGPT to refine my prompt. In just a few minutes, the generated plot almost perfectly matched my existing plot. (I xxxx'ed out the channel ID and API key before posting.) For someone who now only occasionally uses MATLAB, this approach saves time and will hopefully allow me to tap into elements of MATLAB that are now beyond my skill level and memory. ;)
ChatGPT generated MATLAB code:
% MATLAB code to create a ThingSpeak Visualization for temperature readings
% Define channel ID and Read API Key
channelID = xxxxxxx;
readAPIKey = 'XXXXXXXXXXXXXXXX';
% Number of data points to retrieve
numPoints = 100;
% Read data from the ThingSpeak channel for fields 3 to 6
[data, time] = thingSpeakRead(channelID, ...
'Fields', [3 4 5 6], ...
'NumPoints', numPoints, ...
'ReadKey', readAPIKey);
% Replace any value 50 or less with the nearest non-zero, non-negative value
for i = 1:size(data, 2)
% Identify indices where the data is 50 or less
badIndices = find(data(:,i) <= 50);
% Identify indices where the data is valid (greater than 50)
validIndices = find(data(:,i) > 50);
% Interpolate to replace bad values
if ~isempty(validIndices)
data(badIndices, i) = interp1(validIndices, data(validIndices, i), badIndices, 'linear', 'extrap');
end
end
% Plot the data
figure;
colororder(["#FF0000","#FFBB00","#00BBFF", "#0000FF"]); % Set the color order
plot(time, data(:,1), 'LineWidth', 2); hold on;
plot(time, data(:,2), 'LineWidth', 2);
plot(time, data(:,3), 'LineWidth', 2);
plot(time, data(:,4), 'LineWidth', 2);
hold off;
% Add labels and title
xlabel('Time');
ylabel('Temperature (°F)');
title('Nest Nanny 02 (NN-02) Todays Temperature Readings');
% Add legend and move it to the right of the chart
legend({'Surface Temp', '1/4 Temp', '3/4 Temp', 'Deep Temp'}, ...
'Location', 'eastoutside');
% Format the time on the x-axis
datetick('x', 'HH:MM:SS', 'keepticks');
grid on;
% Adjust the figure for better readability
set(gca, 'FontSize', 12);
Plot Comparison:
I am creating an ESP32 device which will upload data to thingspeak channel and I want the data to be displayed on my website after login. I have succesfully completed the first part of uploading the data to thingspeak. Any suggestions with second part will be very much appreciated.
Hi,
I tried several times to clear my channel data.
I would expect, when I click on Channel settings-clear channel all data from the channel is gone.
For me the data stay in. Delete channel works fine.
Is there a trick?
many thanks for your help
HEP
I'm almost embarressed enough to not ask this. :) I assumed sorting the "Updated" column in the "My Channels" view would sort my channels based on when data was last written to (last updated to) the channel
However, I have channels that have received date in August and yet the date/time stamp in the Uodated column displays a June date and therefore they sort in the wrong order. Does "update" mean something other than a data update, such as a settings update? If so, if there a way to sort the channels by the more recent data update?
With a deployment of ThingSpeak on August 15th, 2024, we are using a new library for visualization of ThingSpeak channel charts. This should require no changes on your part. If you notice any discrepancies/differences in your channel visualization, please post a screenshot on this thread.
Due to API changes at X, formerly known as Twitter, the integration between ThingSpeak and X, specifically the ThingTweet functionality, was not operational for a number of months. As of August 1st, 2024, the ThingTweet functionality is being deprecated.
The alternative, which requires manual steps due to X requiring manual application for a developer account, is to use the TWITTER function from Datafeed toolbox in MATLAB code. You can then create a React that is associated with this MATLAB code to post to X.
I use "x = ThingSpeak.writeFields(myChannelNumber1, myWriteAPIKey1);" in my code to update the ThingSpeak channel. 4 fields are associated with this channel. This statement is executed about once every 5 minutes.
Roughly 60% of the time, I got an error message "HTTP error code -301". The other 40% of time the channel update is successful. What does the "HTTP error code -301" mean? Any suggestion on how to improve the success rate of the channel update
Problem statement: I've written a visualization that I'd like to use on potentially hundreds of different channels in my commerical account. Because it contains code that's unique to the channel (channel id, read API key, etc.) I have to create and maintain a duplicate visualization for each channel. This is wasteful, a source of errors, and almost intractable for a commercial customer with a high channel count.
My request is that MATLAB Visualizations be extended to support parameters, but only a predefined set to reduce the scope. I would propose a subset of the parameters currently supported by the ThingSpeak API. For example, thingSpeakRead supports (requires) readChannelID, NumPoints, and a ReadKey etc. If those were elevated to also be allowed as Visualization parameters, I imagine it would satisfy a large subset of user needs.
The poor man's version of this would be if ThingSpeak supported just one special parameter, such as %CHANNEL_ID%. If this was available within the visualization code one could use it as a key into table to get the other pieces of data like API keys, etc. It would be have to be passed on the visualization url (https://thingspeak.com/apps/matlab_visualizations/573779?readChannelID=xxxxx). Not sure how the visualization would pick it up in the use case where it's called from the ThingSpeak website under the user's list of MATLAB Visualizations. Perhaps it can be prompted for.
I initially considered user defined functions or libraries but they are not supported and I can see that that would require even more development work to support. The workarounds described in this thread aren't suitable for me. https://www.mathworks.com/matlabcentral/answers/2102981-how-to-use-private-functions-lib-in-thingspeak?s_tid=srchtitle_community_thingspeak_14_libraries
thanks!
Tom
how can I link a chinese flow meter to this website
Die Anzeige der Werte in den einzelnen Feldern ist nicht aktuell.
So werden z.B. um 18:00 Uhr nur die Werte bis 14:00 Uhr angezeigt, auch das verändern des Zeitfensters bringt keine Abhilfe.
Hat jemand eine Idee wie ich die der Uhrzeit ensprechenden Werte zur Anzeige bringe.
Die Werte werden von Shellies und BitShake kontinuierlich übertragen.
My thingSpeak channel kept on updateing the same signal as early eventhough my simulink have update the new signal. How to solve this?
Hi ThingSpeak Community,
I hope you are all doing well.
I am currently setting up a Vodafone ACL for a SIM card that will be used in a device destined for a remote charity deployment in a week. The goal is to ensure that the device can reliably upload data to ThingSpeak without any connectivity issues.
Here are the details of my current ACL setup:
- FQDN: api.thingspeak.com (specified as the API endpoint)
- IPv4 Address: 184.106.153.149 (found online)
- Port: (left empty)
I've attached a photo of the setup for reference.
Could you please confirm if the above ACL settings are correct? Additionally, if there are any other considerations or settings I should be aware of for ensuring reliable connectivity with ThingSpeak, I would greatly appreciate your guidance.
Currently, all I am using for the device credentials is the PIN number. Do I need to adjust any settings in the Arduino code or the ACL to maintain stable connectivity with ThingSpeak, especially considering the device will be in a remote location and difficult to access for adjustments?
Your prompt assistance and advice will be immensely valuable, as I want to ensure everything is correctly configured before deployment.
Thank you very much!
Best regards,
Arthur
While searching the internet for some books on ordinary differential equations, I came across a link that I believe is very useful for all math students and not only. If you are interested in ODEs, it's worth taking the time to study it.
A First Look at Ordinary Differential Equations by Timothy S. Judson is an excellent resource for anyone looking to understand ODEs better. Here's a brief overview of the main topics covered:
- Introduction to ODEs: Basic concepts, definitions, and initial differential equations.
- Methods of Solution:
- Separable equations
- First-order linear equations
- Exact equations
- Transcendental functions
- Applications of ODEs: Practical examples and applications in various scientific fields.
- Systems of ODEs: Analysis and solutions of systems of differential equations.
- Series and Numerical Methods: Use of series and numerical methods for solving ODEs.
This book provides a clear and comprehensive introduction to ODEs, making it suitable for students and new researchers in mathematics. If you're interested, you can explore the book in more detail here: A First Look at Ordinary Differential Equations.
I have lon and lat and signal stengths plotting from my roaming GPS Lora module that reports signal strength to Thingspeak at it's location. I got GEOSCATTER plotting location circles.But i want extrapulate?Interp?Heatmap. the stengths between the points. When i use Interp i end up timiming out. How do i modify my code to do this?
Public Channel 214526
Cheers Andy
Hallo zusammen,
seit ein paar Tagen werden sämtliche meiner Visualisierungen nicht mehr aktualisiert. Im Editiermodus läuft der Code durch und die Grafik wird korrekt erzeugt.
Hat jemand eine Idee was da schief läuft?
Danke & viele Grüße
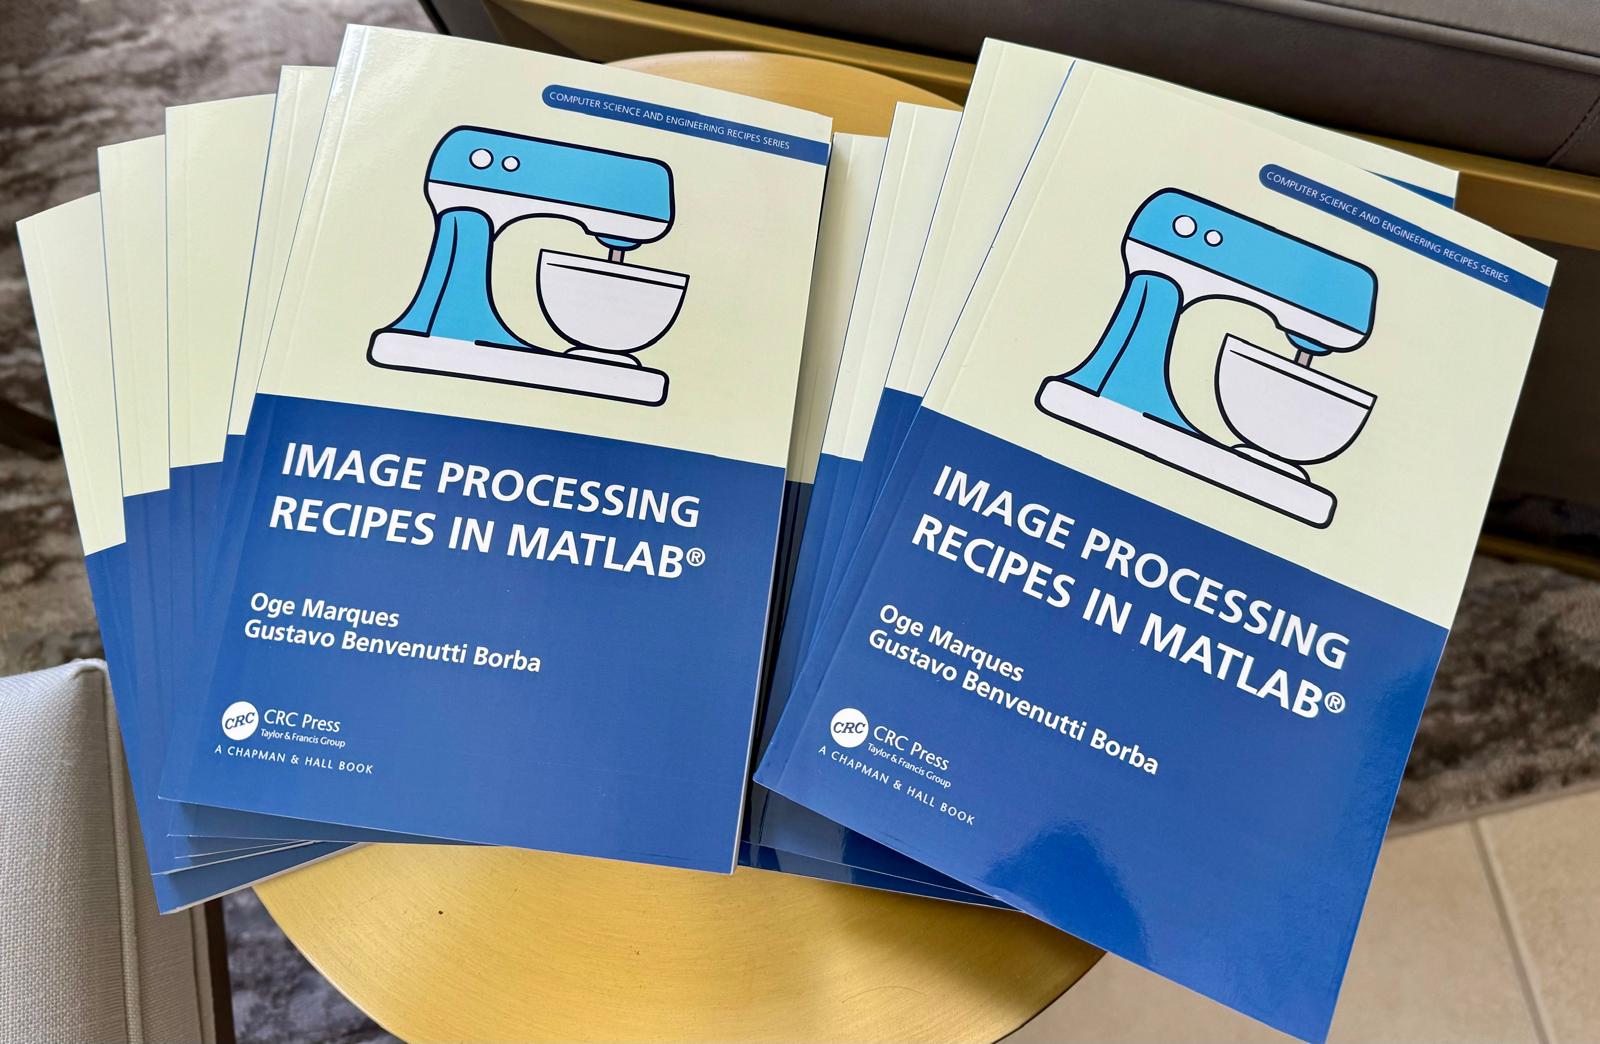
📚 New Book Announcement: "Image Processing Recipes in MATLAB" 📚
I am delighted to share the release of my latest book, "Image Processing Recipes in MATLAB," co-authored by my dear friend and colleague Gustavo Benvenutti Borba.
This 'cookbook' contains 30 practical recipes for image processing, ranging from foundational techniques to recently published algorithms. It serves as a concise and readable reference for quickly and efficiently deploying image processing pipelines in MATLAB.
Gustavo and I are immensely grateful to the MathWorks Book Program for their support. We also want to thank Randi Slack and her fantastic team at CRC Press for their patience, expertise, and professionalism throughout the process.
___________
Hi Helpdesk,
I urgently seek assistance with an issue that has persisted for a week. I am using Node-RED to interface my gateway and vibration sensor. The sensor sends 960 packets of X, Y, and Z data every 5 minutes. I retrieve and send this data through my Thingspeak42 node to my Thingspeak channel.
I am subscribed to the Thingspeak Student paid plan (see attached "12.png"). Despite this, Thingspeak is inconsistently snipping my data. For example, my X-field sometimes receives only 78 out of 960 points, and similar inconsistencies occur with the Y and Z fields.
Attached is "vibration data node red.png," showing an attempt to send just 120 packets to my Thingspeak channel. However, only 93 data points are received. Also attached is a JSON snapshot of field 2 - X_values, showing only 93 points ("JSON Field 2 data.png"). This is disappointing given that I am paying for the student plan, which should support 33 million points/year per unit (~90,000/day per unit).
I urgently require an explanation and resolution for this issue. Please provide immediate assistance.
Kind regards,
Krish
I have an Arduino Uno R3 with an integrated ESP 8266. With the Arduino Uno, I measure some capacitive humidity sensors and a DHT 22 temperature and humidity sensor. The measurements are sent to the serial port and the ESP 8266 picks them up and uploads them to ThingSpeak. My problem is that it does this randomly and not in the assigned fields. Could someone help me? Thank you very much
Hi team,
Could you please confirm us about the process power and computational capacity of ThingSpeak i.e. how quickly and efficiently my MATLAB code can execute on ThingSpeak? What other specifications related to data communication and integration are there in ThingSpeak? As all specifications are not mentioned here: https://thingspeak.com/prices/thingspeak_academic
Thanks.
Regards,
Tanusree