Results for
I am deeply honored to announce the official publication of my latest academic volume:
MATLAB for Civil Engineers: From Basics to Advanced Applications
(Springer Nature, 2025).
This work serves as a comprehensive bridge between theoretical civil engineering principles and their practical implementation through MATLAB—a platform essential to the future of computational design, simulation, and optimization in our field.
Structured to serve both academic audiences and practicing engineers, this book progresses from foundational MATLAB programming concepts to highly specialized applications in structural analysis, geotechnical engineering, hydraulic modeling, and finite element methods. Whether you are a student building analytical fluency or a professional seeking computational precision, this volume offers an indispensable resource for mastering MATLAB's full potential in civil engineering contexts.
With rigorously structured examples, case studies, and research-aligned methods, MATLAB for Civil Engineers reflects the convergence of engineering logic with algorithmic innovation—equipping readers to address contemporary challenges with clarity, accuracy, and foresight.
📖 Ideal for:
— Graduate and postgraduate civil engineering students
— University instructors and lecturers seeking a structured teaching companion
— Professionals aiming to integrate MATLAB into complex real-world projects
If you are passionate about engineering resilience, data-informed design, or computational modeling, I invite you to explore the work and share it with your network.
🧠 Let us advance the discipline together through precision, programming, and purpose.

I saw this on Reddit and thought of the past mini-hack contests. We have a few folks here who can do something similar with MATLAB.

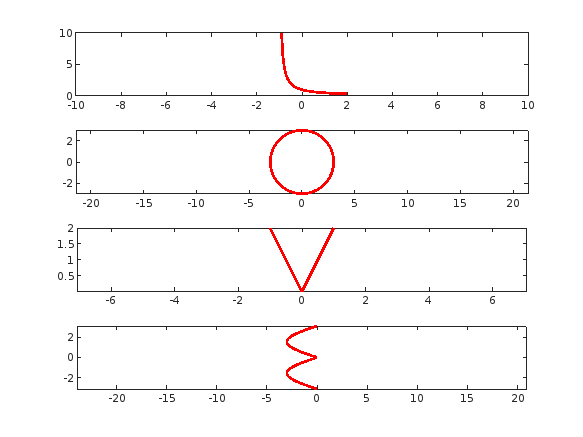
I had an error in the web version Matlab, so I exited and came back in, and this boy was plotted.
Bom dia se alguém puder me ajudar, meu código abaixo, não estou conseguintdo conectar o meu Esp8266 ao ThingSpeak, o erro tá na conexão. Estou usando o MicroPython e NodeMCU na plataforma Pytohn o sistema operacional Ubuntu 20
# DHT11 -> ESP8266/ESP32
# 1(Vcc) -> 3v3
# 2(Data) -> GPIO12
# 4(Gnd) -> Gnd
import time, network, machine
from dht import DHT11
from machine import Pin
from umqtt.simple import MQTTClient
print("Iniciando...")
dht = DHT11(Pin(12, Pin.IN, Pin.PULL_UP))
estacao = network.WLAN(network.STA_IF)
estacao.active(True)
estacao.connect('xxxxxxx', 'xxxxxxxxx')
while estacao.isconnected() == False:
machine.idle()
print('Conexao realizada.')
print(estacao.ifconfig())
SERVIDOR = "mqtt.thingspeak.com"
CHANNEL_ID = "XXXXXXXXXXXXXXXXX"
WRITE_API_KEY = "XXXXXXXXXXXXXXXXXXXXX"
topico = "channels/" + CHANNEL_ID + "/publish/" + WRITE_API_KEY
cliente = MQTTClient("umqtt_client", SERVIDOR)
try:
while True:
dht.measure()
temp = dht.temperature()
umid = dht.humidity()
print('Temperatura: %3.1f °C' %temp)
print('Umidade: %3.1f %%' %umid)
conteudo = "field1=" + str(temp) + "&field2=" + str(umid)
print ('Conectando a ThingSpeak...')
cliente.connect()
cliente.publish(topico, conteudo)
cliente.disconnect()
print ('Envio realizado.')
time.sleep(600.0)
except KeyboardInterrupt:
estacao.disconnect()
estacao.active(False)
print("Fim.")
*****************************************************************************************************
No shell aparece como resposta:
MPY: soft reboot
Iniciando...
Conexao realizada.
('192.168.0.23', '255.255.255.0', '192.168.0.1', '8.8.8.8')
Temperatura: 29.0 °C
Umidade: 63.0 %
Conectando a ThingSpeak...
Traceback (most recent call last):
File "<stdin>", line 38, in <module>
File "umqtt/simple.py", line 67, in connect
OSError: -2
linha 38 é cliente.connect()
It seems like the financial news is always saying the stock market is especially volatile now. But is it really? This code will show you the daily variation from the prior day. You can see that the average daily change from one day to the next is 0.69%. So any change in the stock market from the prior day less than about 0.7% or 1% is just normal "noise"/typical variation. You can modify the code to adjust the starting date for the analysis. Data file (Excel workbook) is attached (hopefully - I attached it twice but it's not showing up yet).

% Program to plot the Dow Jones Industrial Average from 1928 to May 2025, and compute the standard deviation.
% Data available for download at https://finance.yahoo.com/quote/%5EDJI/history?p=%5EDJI
% Just set the Time Period, then find and click the download link, but you ned a paid version of Yahoo.
%
% If you have a subscription for Microsoft Office 365, you can also get historical stock prices.
% Reference: https://support.microsoft.com/en-us/office/stockhistory-function-1ac8b5b3-5f62-4d94-8ab8-7504ec7239a8#:~:text=The%20STOCKHISTORY%20function%20retrieves%20historical,Microsoft%20365%20Business%20Premium%20subscription.
% For example put this in an Excel Cell
% =STOCKHISTORY("^DJI", "1/1/2000", "5/10/2025", 0, 1, 0, 1,2,3,4, 5)
% and it will fill out a table in Excel
%====================================================================================================================
clc; % Clear the command window.
close all; % Close all figures (except those of imtool.)
imtool close all; % Close all imtool figures if you have the Image Processing Toolbox.
clear; % Erase all existing variables. Or clearvars if you want.
workspace; % Make sure the workspace panel is showing.
format long g;
format compact;
fontSize = 14;
filename = 'Dow Jones Industrial Index.xlsx';
data = readtable(filename);
% Date,Close,Open,High,Low,Volume
dates = data.Date;
closing = data.Close;
volume = data.Volume;
% Define start date and stop date
startDate = datetime(2011,1,1)
stopDate = dates(end)
selectedDates = dates > startDate;
% Extract those dates:
dates = dates(selectedDates);
closing = closing(selectedDates);
volume = volume(selectedDates);
% Plot Volume
hFigVolume = figure('Name', 'Daily Volume');
plot(dates, volume, 'b-');
grid on;
xticks(startDate:calendarDuration(5,0,0):stopDate)
title('Dow Jones Industrial Average Volume', 'FontSize', fontSize);
hFig = figure('Name', 'Daily Standard Deviation');
subplot(3, 1, 1);
plot(dates, closing, 'b-');
xticks(startDate:calendarDuration(5,0,0):stopDate)
drawnow;
grid on;
caption = sprintf('Dow Jones Industrial Average from %s through %s', dates(1), dates(end));
title(caption, 'FontSize', fontSize);
% Get the average change from one trading day to the next.
diffs = 100 * abs(closing(2:end) - closing(1:end-1)) ./ closing(1:end-1);
subplot(3, 1, 2);
averageDailyChange = mean(diffs)
% Looks pretty noisy so let's smooth it for a nicer display.
numWeeks = 4;
diffs = sgolayfilt(diffs, 2, 5*numWeeks+1);
plot(dates(2:end), diffs, 'b-');
grid on;
xticks(startDate:calendarDuration(5,0,0):stopDate)
hold on;
line(xlim, [averageDailyChange, averageDailyChange], 'Color', 'r', 'LineWidth', 2);
ylabel('Percentage', 'FontSize', fontSize);
caption = sprintf('Day-to-Day Change Percentage. Average Daily Change (from prior day) = %.2f%%', averageDailyChange);
title(caption, 'FontSize', fontSize);
drawnow;
% Get the stddev over a 5 trading day window.
sd = stdfilt(closing, ones(5, 1));
% Get it relative to the magnitude.
sd = sd ./ closing * 100;
averageVariation = mean(sd)
numWeeks = 2;
% Looks pretty noisy so let's smooth it for a nicer display.
sd = sgolayfilt(sd, 2, 5*numWeeks+1);
% Plot it.
subplot(3, 1, 3);
plot(dates, sd, 'b-');
grid on;
xticks(startDate:calendarDuration(5,0,0):stopDate)
hold on;
line(xlim, [averageVariation, averageVariation], 'Color', 'r', 'LineWidth', 2);
ylabel('Percentage', 'FontSize', fontSize);
caption = sprintf('Weekly Standard Deviation, Averaged Over %d Weeks (%d trading days). Mean SD = %.2f', ...
numWeeks, 5*numWeeks+1, averageVariation);
title(caption, 'FontSize', fontSize);
% Maximize figure window.
g = gcf;
g.WindowState = 'maximized';
I want to use Simulink for model-based development of the TC3XX series development board, but I am not sure about the development process and toolchain? Is there a free toolchain available for me to use? Do you have a detailed development tutorial?
I have a pressure vs. time plot resulting from the input of an elastic wave, which I obtained from an Abaqus simulation. So, I have access to all the data. Now, I want to convert this time-domain graph into a frequency-domain graph using FFT in MATLAB.
I came across a code through ChatGPT, but I’m not fully confident in relying on it. Could anyone kindly clarify whether the formulas used for FFT in MATLAB are universal for all types of signals? Or is there a more effective and reliable method I should consider for this purpose?
Hi guys!
Im doing a project where i need to simulate a ship connected to the grid. I have a grid->converter AC-DC-AC -> dynamic load. My converter has to keep the voltage consistent and what changes is the current. Can somebody help me?
I am pleased to announce the 6th Edition of my book MATLAB Recipes for Earth Sciences with Springer Nature
also in the MathWorks Book Program
It is now almost exactly 20 years since I signed the contract with Springer for the first edition of the book. Since then, the book has grown from 237 to 576 pages, with many new chapters added. I would like to thank my colleagues Norbert Marwan and Robin Gebbers, who have each contributed two sections to Chapters 5, 7 and 9.
And of course, my thanks go to the excellent team at the MathWorks Book Program and the numerous other MathWorks experts who have helped and advised me during the last 30+ years working with MATLAB. And of course, thank you Springer for 20 years of support.
This book introduces methods of data analysis in the earth sciences using MATLAB, such as basic statistics for univariate, bivariate, and multivariate data sets, time series analysis, signal processing, spatial and directional data analysis, and image analysis.
Martin H. Trauth

Hello ThingSpeak Community,
I have an energy meter sending data of energy consumed in 4 rooms in hexadecimal values to Sigfox and I was trying to decode the payload and route it to ThingSpeak.
All the datas are sent at the same time.
But ThingSpeak only receives 1 of them and plots them.
However, the rest 3 are missing. Is this because I am trying the free version ?
Would the payed version be capable of receiving all the 4 messages ?
Hi! I'm Joseff and along with being a student in chemical engineering, one of my great passions is language-learning. I learnt something really cool recently about Catalan (a romance language closely related to Valencian that's spoken in Andorra, Catalonia, and parts of Spain) — and that is how speakers tell the time.
While most European languages stick to the standard minutes-past / minutes-to between hours, Catalan does something really quite special, with a focus on the quarters (quarts [ˈkwarts]). To see what I mean, take a look at this clock made by Penguin___Lover on Instructables :
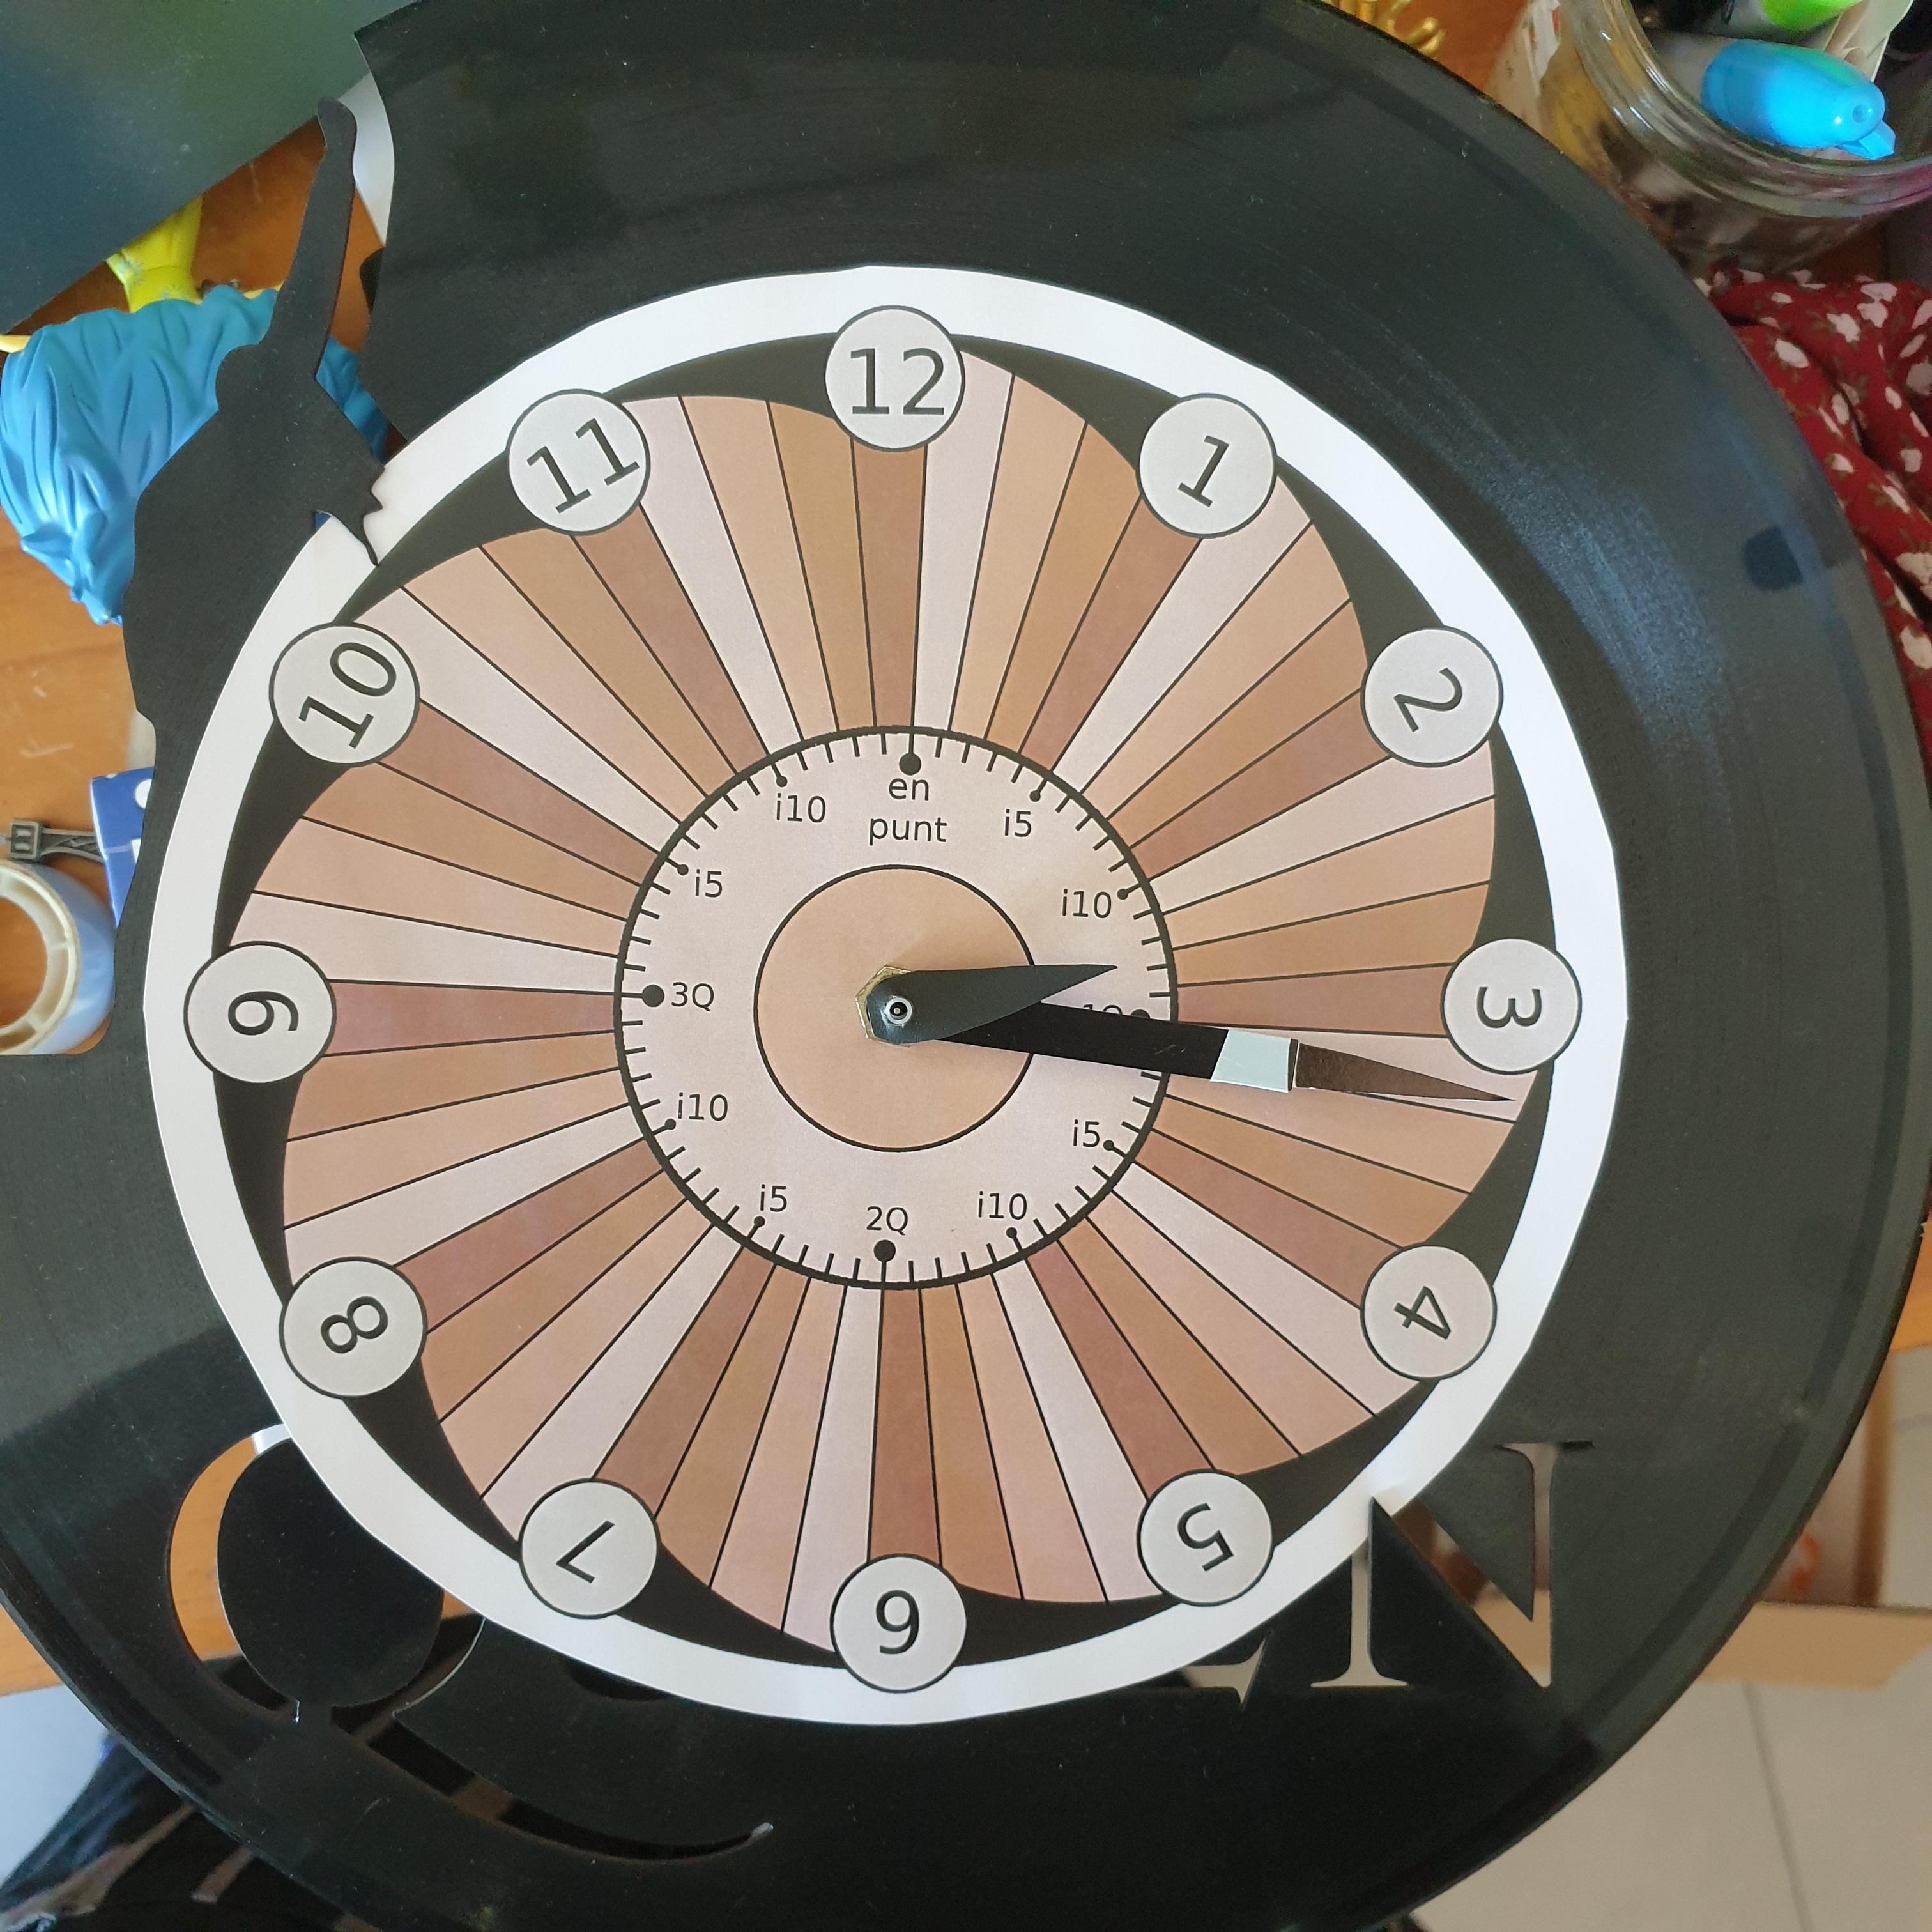
If you want to tell the time in Catalan, you should refer to the following hour (the one that's still to come), and how many minutes have passed or will pass for the closest quarter (sometimes half-quarter / mig quart [ˈmit͡ʃ kwart]) — clear as mud? It's definitely one of the more difficult things to wrap your head around as a learner. But fear not, with the power of MATLAB, we'll understand in no time!
To make a tool to tell the time in Catalan, the first thing we need to do is extract the current time into its individual hours, minutes and seconds*
function catalanTime = quinahora()
% Get the current time
[hours, minutes, seconds] = hms(datetime("now"));
% Adjust hours to 12-hour format
catalanHour = mod(hours-1, 12)+1;
nextHour = mod(hours, 12)+1;
Then to defining the numbers in catalan. It's worth noting that because the hours are feminine and the minutes are masculine, the words for 1 and 2 is different too (this is not too weird as languages go, in fact for my native Welsh there's a similar pattern between 2 and 4).
% Define the numbers in Catalan
catNumbers.masc = ["un", "dos", "tres", "quatre", "cinc"];
catNumbers.fem = ["una", "dues", "tres", "quatre",...
"cinc", "sis", "set", "vuit",...
"nou", "deu", "onze", "dotze"];
Okay, now it's starting to get serious! I mentioned before that this traditional time telling system is centred around the quarters — and that is true, but you'll also hear about the mig de quart (half of a quarter) * which is why we needed that seconds' precision from earlier!
% Define 07:30 intervals around the clock from 0 to 60
timeMarks = 0:15/2:60;
timeFraction = minutes + seconds / 60; % get the current position
[~, idx] = min(abs(timeFraction - timeMarks)); % extract the closest timeMark
mins = round(timeFraction - timeMarks(idx)); % round to the minute
After getting the fraction of the hour that we'll use later to tell the time, we can look into how many minutes it differs from that set time, using menys (less than) and i (on top of). There's also a bit of an AM/PM distinction, so you can use this function and know whether it's morning or night!
% Determine the minute string (diffString logic)
diffString = '';
if mins < 0
diffString = sprintf(' menys %s', catNumbers.masc(abs(mins)));
elseif mins > 0
diffString = sprintf(' i %s', catNumbers.masc(abs(mins)));
end
% Determine the part of the day (partofDay logic)
if hours < 12
partofDay = 'del matí'; % Morning (matí)
elseif hours < 18
partofDay = 'de la tarda'; % Afternoon (tarda)
elseif hours < 21
partofDay = 'del vespre'; % Evening (vespre)
else
partofDay = 'de la nit'; % Night (nit)
end
% Determine 'en punt' (o'clock exactly) based on minutes
enPunt = '';
if mins == 0
enPunt = ' en punt';
end
Now all that's left to do is define the main part of the string, which is which mig quart we are in. Since we extracted the index idx earlier as the closest timeMark, it's just a matter of indexing into this after the strings have been defined.
% Create the time labels
labels = {sprintf('són les %s%s%s %s', catNumbers.fem(catalanHour), diffString, enPunt, partofDay), ...
sprintf('és mig quart de %s%s %s', catNumbers.fem(nextHour), diffString, partofDay), ...
sprintf('és un quart de %s%s %s', catNumbers.fem(nextHour), diffString, partofDay), ...
sprintf('és un quart i mig de %s%s %s', catNumbers.fem(nextHour), diffString, partofDay), ...
sprintf('són dos quarts de %s%s %s', catNumbers.fem(nextHour), diffString, partofDay), ...
sprintf('són dos quarts i mig de %s%s %s', catNumbers.fem(nextHour), diffString, partofDay), ...
sprintf('són tres quarts de %s%s %s', catNumbers.fem(nextHour), diffString, partofDay), ...
sprintf('són tres quarts i mig de %s%s %s', catNumbers.fem(nextHour), diffString, partofDay), ...
sprintf('són les %s%s%s %s', catNumbers.fem(nextHour), diffString, enPunt, partofDay)};
catalanTime = labels{idx};
Then we need to do some clean up — the definite article les / la and the preposition de don't play nice with un and the initial vowel in onze, so there's a little replacement lookup here.
% List of old and new substrings for replacement
oldStrings = {'les un', 'són la una', 'de una', 'de onze'};
newStrings = {'la una', 'és la una', 'd''una', 'd''onze'};
% Apply replacements using a loop
for i = 1:length(oldStrings)
catalanTime = strrep(catalanTime, oldStrings{i}, newStrings{i});
end
end
quinahora()
So, can you work out what time it was when I made this post? 🤔
And how do you tell the time in your language?
Fins després!
I am glad to inform and share with you all my new text book titled "Inverters and AC Drives
Control, Modeling, and Simulation Using Simulink", Springer, 2024. This text book has nine chapters and three appendices. A separate "Instructor Manual" is rpovided with solutions to selected model projects. The salent features of this book are given below:
- Provides Simulink models for various PWM techniques used for inverters
- Presents vector and direct torque control of inverter-fed AC drives and fuzzy logic control of converter-fed AC drives
- Includes examples, case studies, source codes of models, and model projects from all the chapters
The Springer link for this text book is given below:
This book is also in the Mathworks book program:
tiledlayout(4,1);
% Plot "L" (y = 1/(x+1), for x > -1)
x = linspace(-0.9, 2, 100); % Avoid x = -1 (undefined)
y =1 ./ (x+1) ;
nexttile;
plot(x, y, 'r', 'LineWidth', 2);
xlim([-10,10])
% Plot "O" (x^2 + y^2 = 9)
theta = linspace(0, 2*pi, 100);
x = 3 * cos(theta);
y = 3 * sin(theta);
nexttile;
plot(x, y, 'r', 'LineWidth', 2);
axis equal;
% Plot "V" (y = -2|x|)
x = linspace(-1, 1, 100);
y = 2 * abs(x);
nexttile;
plot(x, y, 'r', 'LineWidth', 2);
axis equal;
% Plot "E" (x = -3 |sin(y)|)
y = linspace(-pi, pi, 100);
x = -3 * abs(sin(y));
nexttile;
plot(x, y, 'r', 'LineWidth', 2);
axis equal;
Check out the result of "emoji matrix" multiplication below.
- vector multiply vector:
a = ["😁","😁","😁"]
b = ["😂";
"😂"
"😂"]
c = a*b
d = b*a
- matrix multiply matrix:
matrix1 = [
"😀", "😃";
"😄", "😁"]
matrix2 = [
"😆", "😅";
"😂", "🤣"]
resutl = matrix1*matrix2
enjoy yourself!
For Valentine's day this year I tried to do something a little more than just the usual 'Here's some MATLAB code that draws a picture of a heart' and focus on how to share MATLAB code. TL;DR, here's my advice
- Put the code on GitHub. (Allows people to access and collaborate on your code)
- Set up 'Open in MATLAB Online' in your GitHub repo (Allows people to easily run it)
I used code by @Zhaoxu Liu / slandarer and others to demonstrate. I think that those two steps are the most impactful in that they get you from zero to one but If I were to offer some more advice for research code it would be
3. Connect the GitHub repo to File Exchange (Allows MATLAB users to easily find it in-product).
4. Get a Digitial Object Identifier (DOI) using something like Zenodo. (Allows people to more easily cite your code)
There is still a lot more you can do of course but if everyone did this for any MATLAB code relating to a research paper, we'd be in a better place I think.
Here's the article: On love and research software: Sharing code with your Valentine » The MATLAB Blog - MATLAB & Simulink
What do you think?
Los invito a conocer el libro "Sistemas dinámicos en contexto: Modelación matemática, simulación, estimación y control con MATLAB", el cual ya está disponible en formato digital.
El libro integra diversos temas de los sistemas dinámicos desde un punto de vista práctico utilizando programas de MATLAB y simulaciones en Simulink y utilizando métodos numéricos (ver enlace). Existe mucho material en el blog del libro con posibilidades para comentarios, propuestas y correcciones. Resalto los casos de estudio
Creo que el libro les puede dar un buen panorama del área con la posibilidad de experimentar de manera interactiva con todo el material de MATLAB disponible en formato Live Script. Lo mejor es que se pueden formular preguntas en el blog y hacer propuestas al autor de ejercicios resueltos.
Son bienvenidos los comentarios, sugerencias y correcciones al texto.
I got thoroughly nerd-sniped by this xkcd, leading me to wonder if you can use MATLAB to figure out the dice roll for any given (rational) probability. Well, obviously you can. The question is how. Answer: lots of permutation calculations and convolutions.
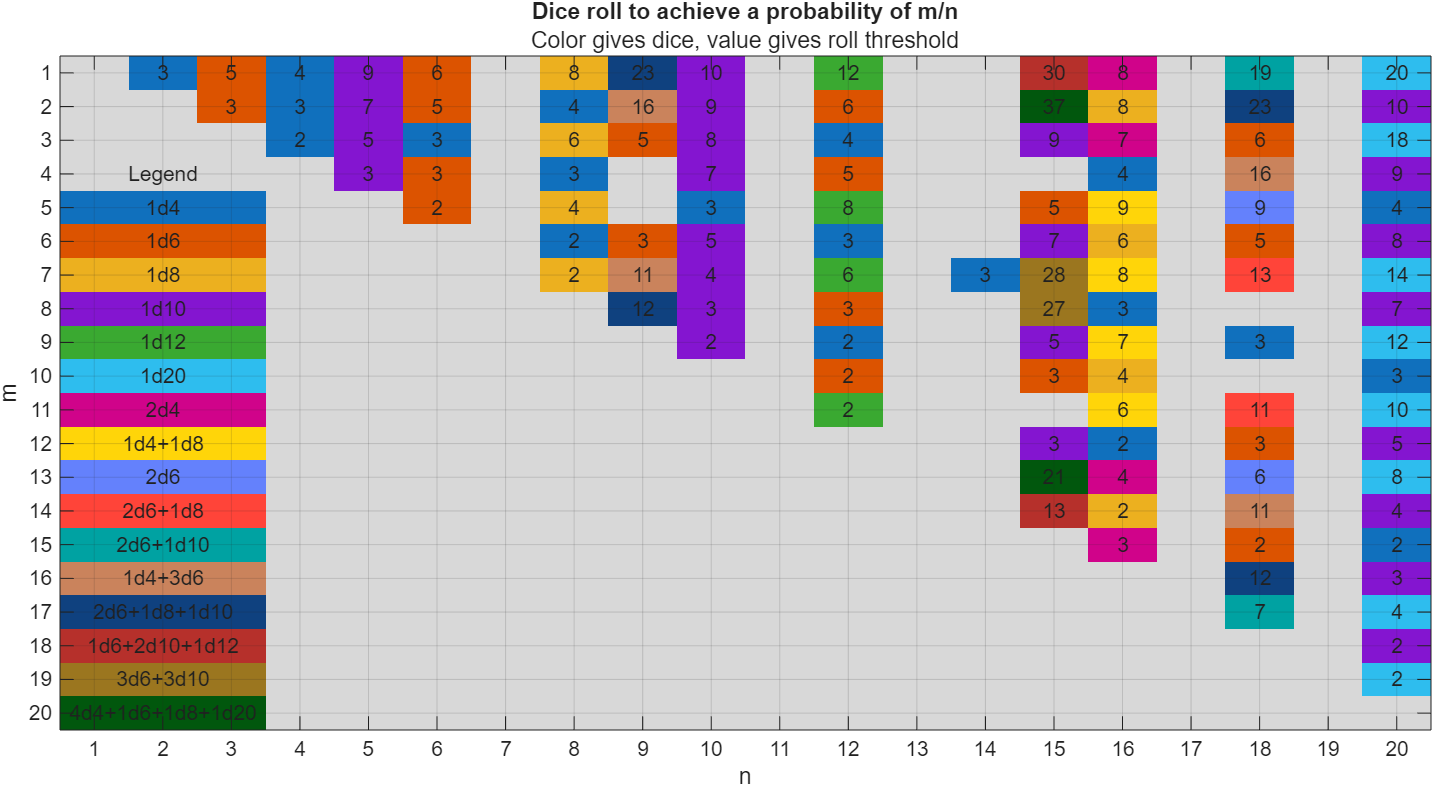
In the original xkcd, the situation described by the player has a probability of 2/9. Looking up the plot, row 2 column 9, shows that you need 16 or greater on (from the legend) 1d4+3d6, just as claimed.
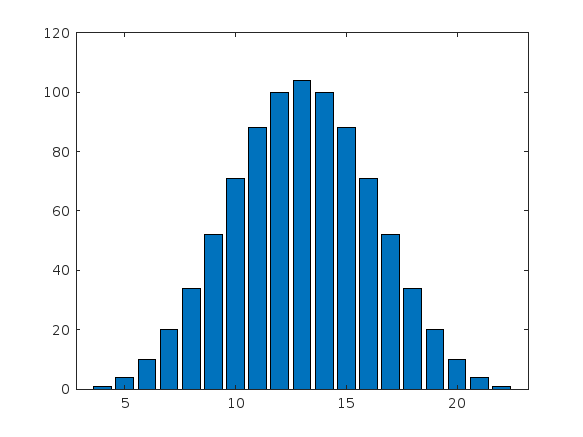
If you missed the bit about convolutions, this is a super-neat trick
[v,c] = dicedist([4 6 6 6]);
bar(v,c)
% Probability distribution of dice given by d
function [vals,counts] = dicedist(d)
% d is a vector of number of sides
n = numel(d); % number of dice
% Use convolution to count the number of ways to get each roll value
counts = 1;
for k = 1:n
counts = conv(counts,ones(1,d(k)));
end
% Possible values range from n to sum(d)
maxtot = sum(d);
vals = n:maxtot;
end
I noticed recently that my data is no longer updating on thingspeak again. Is there a connectivity issues with thingspeak
my code is as below:
#include "DHT.h"
#define DHTPIN 15 // what pin we're connected to
#define DHTTYPE DHT11
DHT dht(DHTPIN, DHTTYPE);
#define THINGSPEAK_API_KEY "1P4RY69D3YMP9R5W"
#include <SoftwareSerial.h>
#include <OneWire.h>
#include <DallasTemperature.h>
//-----------------------------
#include <ArduinoJson.h>
StaticJsonDocument<200>JsonDocument;
SoftwareSerialmyserial(10, 11);
//-------------------------
float voltage;
unsignedintfrac;
//---------------------
#define ONE_WIRE_BUS 5
OneWireoneWire(ONE_WIRE_BUS);
DallasTemperaturesensors(&oneWire);
floatCelcius = 0;
float Fahrenheit = 0;
//==========================================================================================================
bytesensorInterrupt = 0; // 0 = digital pin 2
bytesensorPin = 2;
// The hall-effect flow sensor outputs approximately 4.5 pulses per second per
// litre/minute of flow.
floatcalibrationFactor = 5.5; //==========================================================we change cal factor 4.5 to 5.5 if not work chnage again(4.5)
//========== 5.5 calibration factor is working efficent then 4.5 , 7.5 ,and 6.5
volatile byte pulseCount;
floatflowRate;
unsignedintflowMilliLitres;
unsigned long totalMilliLitres, tempTotal = -1;
unsigned long oldTime;
//-------------------------------------------------------
intpH_Value;
float Voltage;
//----------------------------------------------------------------------------------------------
void setup() {
// put your setup code here, to run once:
Serial.begin(9600);
myserial.begin(9600);
//--------------------------------
pinMode(sensorPin, INPUT);
digitalWrite(sensorPin, HIGH);
pulseCount = 0;
flowRate = 0.0;
flowMilliLitres = 0;
totalMilliLitres = 0; // ============================================================
oldTime = 0;
attachInterrupt(sensorInterrupt, pulseCounter, FALLING);
sensors.begin();
//------------------------------------------------
/********************GSM Communication Starts********************/
if (myserial.available())
Serial.write(myserial.read());
myserial.println("AT");
delay(1000);
myserial.println("AT+SAPBR=3,1,\"Contype\",\"GPRS\"");
delay(1000);
ShowSerialData();
myserial.println("AT+SAPBR=3,1,\"APN\",\"www\"");//APN
delay(1000);
ShowSerialData();
myserial.println("AT+SAPBR=1,1");
delay(1000);
ShowSerialData();
myserial.println("AT+SAPBR=2,1");
delay(1000);
ShowSerialData();
//---------------------------------
}
void loop() {
// put your main code here, to run repeatedly:
inti;
for (i = 0; i< 20; i++)
{
flow_meter();
}
temperature();
turbidity();
delay(1000);
gsm();
}
voidflow_meter()
{
if ((millis() - oldTime) > 1000) // Only process counters once per second
{
// Disable the interrupt while calculating flow rate and sending the value to
// the host
detachInterrupt(sensorInterrupt);
// Because this loop may not complete in exactly 1 second intervals we calculate
// the number of milliseconds that have passed since the last execution and use
// that to scale the output. We also apply the calibrationFactor to scale the output
// based on the number of pulses per second per units of measure (litres/minute in
// this case) coming from the sensor.
flowRate = ((1000.0 / (millis() - oldTime)) * pulseCount) / calibrationFactor;
// Note the time this processing pass was executed. Note that because we've
// disabled interrupts the millis() function won't actually be incrementing right
// at this point, but it will still return the value it was set to just before
// interrupts went away.
oldTime = millis();
// Divide the flow rate in litres/minute by 60 to determine how many litres have
// passed through the sensor in this 1 second interval, then multiply by 1000 to
// convert to millilitres.
flowMilliLitres = (flowRate / 60) * 1000;
// Add the millilitres passed in this second to the cumulative total
totalMilliLitres += flowMilliLitres;
// Print the flow rate for this second in litres / minute
/* Serial.print("Flow rate: ");
Serial.print(int(flowRate)); // Print the integer part of the variable
Serial.print("."); // Print the decimal point */
// Determine the fractional part. The 10 multiplier gives us 1 decimal place.
frac = (flowRate - int(flowRate)) * 10;
Serial.print(frac, DEC) ; // Print the fractional part of the variable
Serial.println("L/min");
/* // Print the number of litres flowed in this second
Serial.print(" Current Liquid Flowing: "); // Output separator
Serial.print(flowMilliLitres);
Serial.print("mL/Sec");
// Print the cumulative total of litres flowed since starting
Serial.print(" Output Liquid Quantity: "); // Output separator
Serial.print(totalMilliLitres);
Serial.println("mL"); */
if ( tempTotal != totalMilliLitres ) {
tempTotal = totalMilliLitres;
// displayVolumeOfWater(totalMilliLitres );
}
// Reset the pulse counter so we can start incrementing again
pulseCount = 0;
// Enable the interrupt again now that we've finished sending output
attachInterrupt(sensorInterrupt, pulseCounter, FALLING);
}
//=========================================================================================================================
}
voidpulseCounter()
{
// Increment the pulse counter
pulseCount++;
}
//-------------------------------------------------------------------------
void temperature()
{
sensors.requestTemperatures();
Celcius = sensors.getTempCByIndex(0);
Fahrenheit = sensors.toFahrenheit(Celcius);
Serial.print(" C ");
Serial.print(Celcius);
// Serial.print(" F ");
// Serial.println(Fahrenheit);
delay(1000);
}
//------------------------------------------------------------
void turbidity()
{
intsensorValue = analogRead(A0);
voltage = sensorValue * (5.0 / 1024.0);
// Serial.println ("Sensor Output (V):");
Serial.println (voltage);
// Serial.println();
delay(1000);
}
//------------------------------------------------------------
voidgsm()
{
myserial.println("AT+HTTPINIT");
delay(1000);
ShowSerialData();
myserial.println("AT+HTTPPARA=\"CID\",1");
delay(1000);
ShowSerialData();
StaticJsonDocument<200>JsonDocument;
JsonObject& object = JsonDocument.createObject();
object.set("TE", Celcius);
object.set("TU", voltage);
object.set("WF", frac);
delay(1000);
object.printTo(Serial);
Serial.println(" ");
String sendtoserver;
object.prettyPrintTo(sendtoserver);
delay(1000);
//myserial.println("AT+HTTPPARA=\"URL\",\"https://api.thingspeak.com/update?api_key=\""); //Server address
myserial.println("AT+HTTPPARA=\"URL\",\"https://api.thingspeak.com/update?api_key=\""); //Server address
delay(1000);
ShowSerialData();
myserial.println("AT+HTTPPARA=\"CONTENT\",\"application/json\"");
delay(1000);
ShowSerialData();
myserial.println("AT+HTTPDATA=" + String(sendtoserver.length()) + ",100000");
Serial.println(sendtoserver);
delay(1000);
ShowSerialData();
myserial.println(sendtoserver);
delay(2000);
ShowSerialData;
myserial.println("AT+HTTPACTION=1");
delay(1000);
ShowSerialData();
myserial.println("AT+HTTPREAD");
delay(1000);
ShowSerialData();
myserial.println("AT+HTTPTERM");
delay(1000);
ShowSerialData;
}
voidShowSerialData()
{
while (myserial.available() != 0)
Serial.write(myserial.read());
delay(1000);
}