Results for
Provide insightful answers
9%
Provide label-AI answer
9%
Provide answer by both AI and human
21%
Do not use AI for answers
46%
Give a button "chat with copilot"
10%
use AI to draft better qustions
5%
1561 votes
I have written, tested, and prepared a function with four subsunctions on my computer for solving one of the problems in the list of Cody problems in MathWorks in three days. Today, when I wanted to upload or copy paste the codes of the function and its subfunctions to the specified place of the problem of Cody page, I do not see a place to upload it, and the ability to copy past the codes. The total of the entire codes and their documentations is about 600 lines, which means that I cannot and it is not worth it to retype all of them in the relevent Cody environment after spending a few days. I would appreciate your guidance on how to enter the prepared codes to the desired environment in Cody.
%% 清理环境
close all; clear; clc;
%% 模拟时间序列
t = linspace(0,12,200); % 时间从 0 到 12,分 200 个点
% 下面构造一些模拟的"峰状"数据,用于演示
% 你可以根据需要替换成自己的真实数据
rng(0); % 固定随机种子,方便复现
baseIntensity = -20; % 强度基线(z 轴的最低值)
numSamples = 5; % 样本数量
yOffsets = linspace(20,140,numSamples); % 不同样本在 y 轴上的偏移
colors = [ ...
0.8 0.2 0.2; % 红
0.2 0.8 0.2; % 绿
0.2 0.2 0.8; % 蓝
0.9 0.7 0.2; % 金黄
0.6 0.4 0.7]; % 紫
% 构造一些带多个峰的模拟数据
dataMatrix = zeros(numSamples, length(t));
for i = 1:numSamples
% 随机峰参数
peakPositions = randperm(length(t),3); % 三个峰位置
intensities = zeros(size(t));
for pk = 1:3
center = peakPositions(pk);
width = 10 + 10*rand; % 峰宽
height = 100 + 50*rand; % 峰高
% 高斯峰
intensities = intensities + height*exp(-((1:length(t))-center).^2/(2*width^2));
end
% 再加一些小随机扰动
intensities = intensities + 10*randn(size(t));
dataMatrix(i,:) = intensities;
end
%% 开始绘图
figure('Color','w','Position',[100 100 800 600],'Theme','light');
hold on; box on; grid on;
for i = 1:numSamples
% 构造 fill3 的多边形顶点
xPatch = [t, fliplr(t)];
yPatch = [yOffsets(i)*ones(size(t)), fliplr(yOffsets(i)*ones(size(t)))];
zPatch = [dataMatrix(i,:), baseIntensity*ones(size(t))];
% 使用 fill3 填充面积
hFill = fill3(xPatch, yPatch, zPatch, colors(i,:));
set(hFill,'FaceAlpha',0.8,'EdgeColor','none'); % 调整透明度、去除边框
% 在每条曲线尾部标注 Sample i
text(t(end)+0.3, yOffsets(i), dataMatrix(i,end), ...
['Sample ' num2str(i)], 'FontSize',10, ...
'HorizontalAlignment','left','VerticalAlignment','middle');
end
%% 坐标轴与视角设置
xlim([0 12]);
ylim([0 160]);
zlim([-20 350]);
xlabel('Time (sec)','FontWeight','bold');
ylabel('Frequency (Hz)','FontWeight','bold');
zlabel('Intensity','FontWeight','bold');
% 设置刻度(根据需要微调)
set(gca,'XTick',0:2:12, ...
'YTick',0:40:160, ...
'ZTick',-20:40:200);
% 设置视角(az = 水平旋转,el = 垂直旋转)
view([211 21]);
% 让三维坐标轴在后方
set(gca,'Projection','perspective');
% 如果想去掉默认的坐标轴线,也可以尝试
% set(gca,'BoxStyle','full','LineWidth',1.2);
%% 可选:在后方添加一个浅色网格平面 (示例)
% 这个与题图右上方的网格类似
[Xplane,Yplane] = meshgrid([0 12],[0 160]);
Zplane = baseIntensity*ones(size(Xplane)); % 在 Z = -20 处画一个竖直面的框
surf(Xplane, Yplane, Zplane, ...
'FaceColor',[0.95 0.95 0.9], ...
'EdgeColor','k','FaceAlpha',0.3);
%% 进一步美化(可根据需求调整)
title('3D Stacked Plot Example','FontSize',12);
constantplane("x",12,FaceColor=rand(1,3),FaceAlpha=0.5);
constantplane("y",0,FaceColor=rand(1,3),FaceAlpha=0.5);
constantplane("z",-19,FaceColor=rand(1,3),FaceAlpha=0.5);
hold off;

Have fun! Enjoy yourself!
We are excited to announce the first edition of the MathWorks AI Challenge. You’re invited to submit innovative solutions to challenges in the field of artificial intelligence. Choose a project from our curated list and submit your solution for a chance to win up to $1,000 (USD). Showcase your creativity and contribute to the advancement of AI technology.
I am pleased to announce the 6th Edition of my book MATLAB Recipes for Earth Sciences with Springer Nature
also in the MathWorks Book Program
It is now almost exactly 20 years since I signed the contract with Springer for the first edition of the book. Since then, the book has grown from 237 to 576 pages, with many new chapters added. I would like to thank my colleagues Norbert Marwan and Robin Gebbers, who have each contributed two sections to Chapters 5, 7 and 9.
And of course, my thanks go to the excellent team at the MathWorks Book Program and the numerous other MathWorks experts who have helped and advised me during the last 30+ years working with MATLAB. And of course, thank you Springer for 20 years of support.
This book introduces methods of data analysis in the earth sciences using MATLAB, such as basic statistics for univariate, bivariate, and multivariate data sets, time series analysis, signal processing, spatial and directional data analysis, and image analysis.
Martin H. Trauth
Hello ThingSpeak Community,
I have an energy meter sending data of energy consumed in 4 rooms in hexadecimal values to Sigfox and I was trying to decode the payload and route it to ThingSpeak.
All the datas are sent at the same time.
But ThingSpeak only receives 1 of them and plots them.
However, the rest 3 are missing. Is this because I am trying the free version ?
Would the payed version be capable of receiving all the 4 messages ?
Hi! I'm Joseff and along with being a student in chemical engineering, one of my great passions is language-learning. I learnt something really cool recently about Catalan (a romance language closely related to Valencian that's spoken in Andorra, Catalonia, and parts of Spain) — and that is how speakers tell the time.
While most European languages stick to the standard minutes-past / minutes-to between hours, Catalan does something really quite special, with a focus on the quarters (quarts [ˈkwarts]). To see what I mean, take a look at this clock made by Penguin___Lover on Instructables :
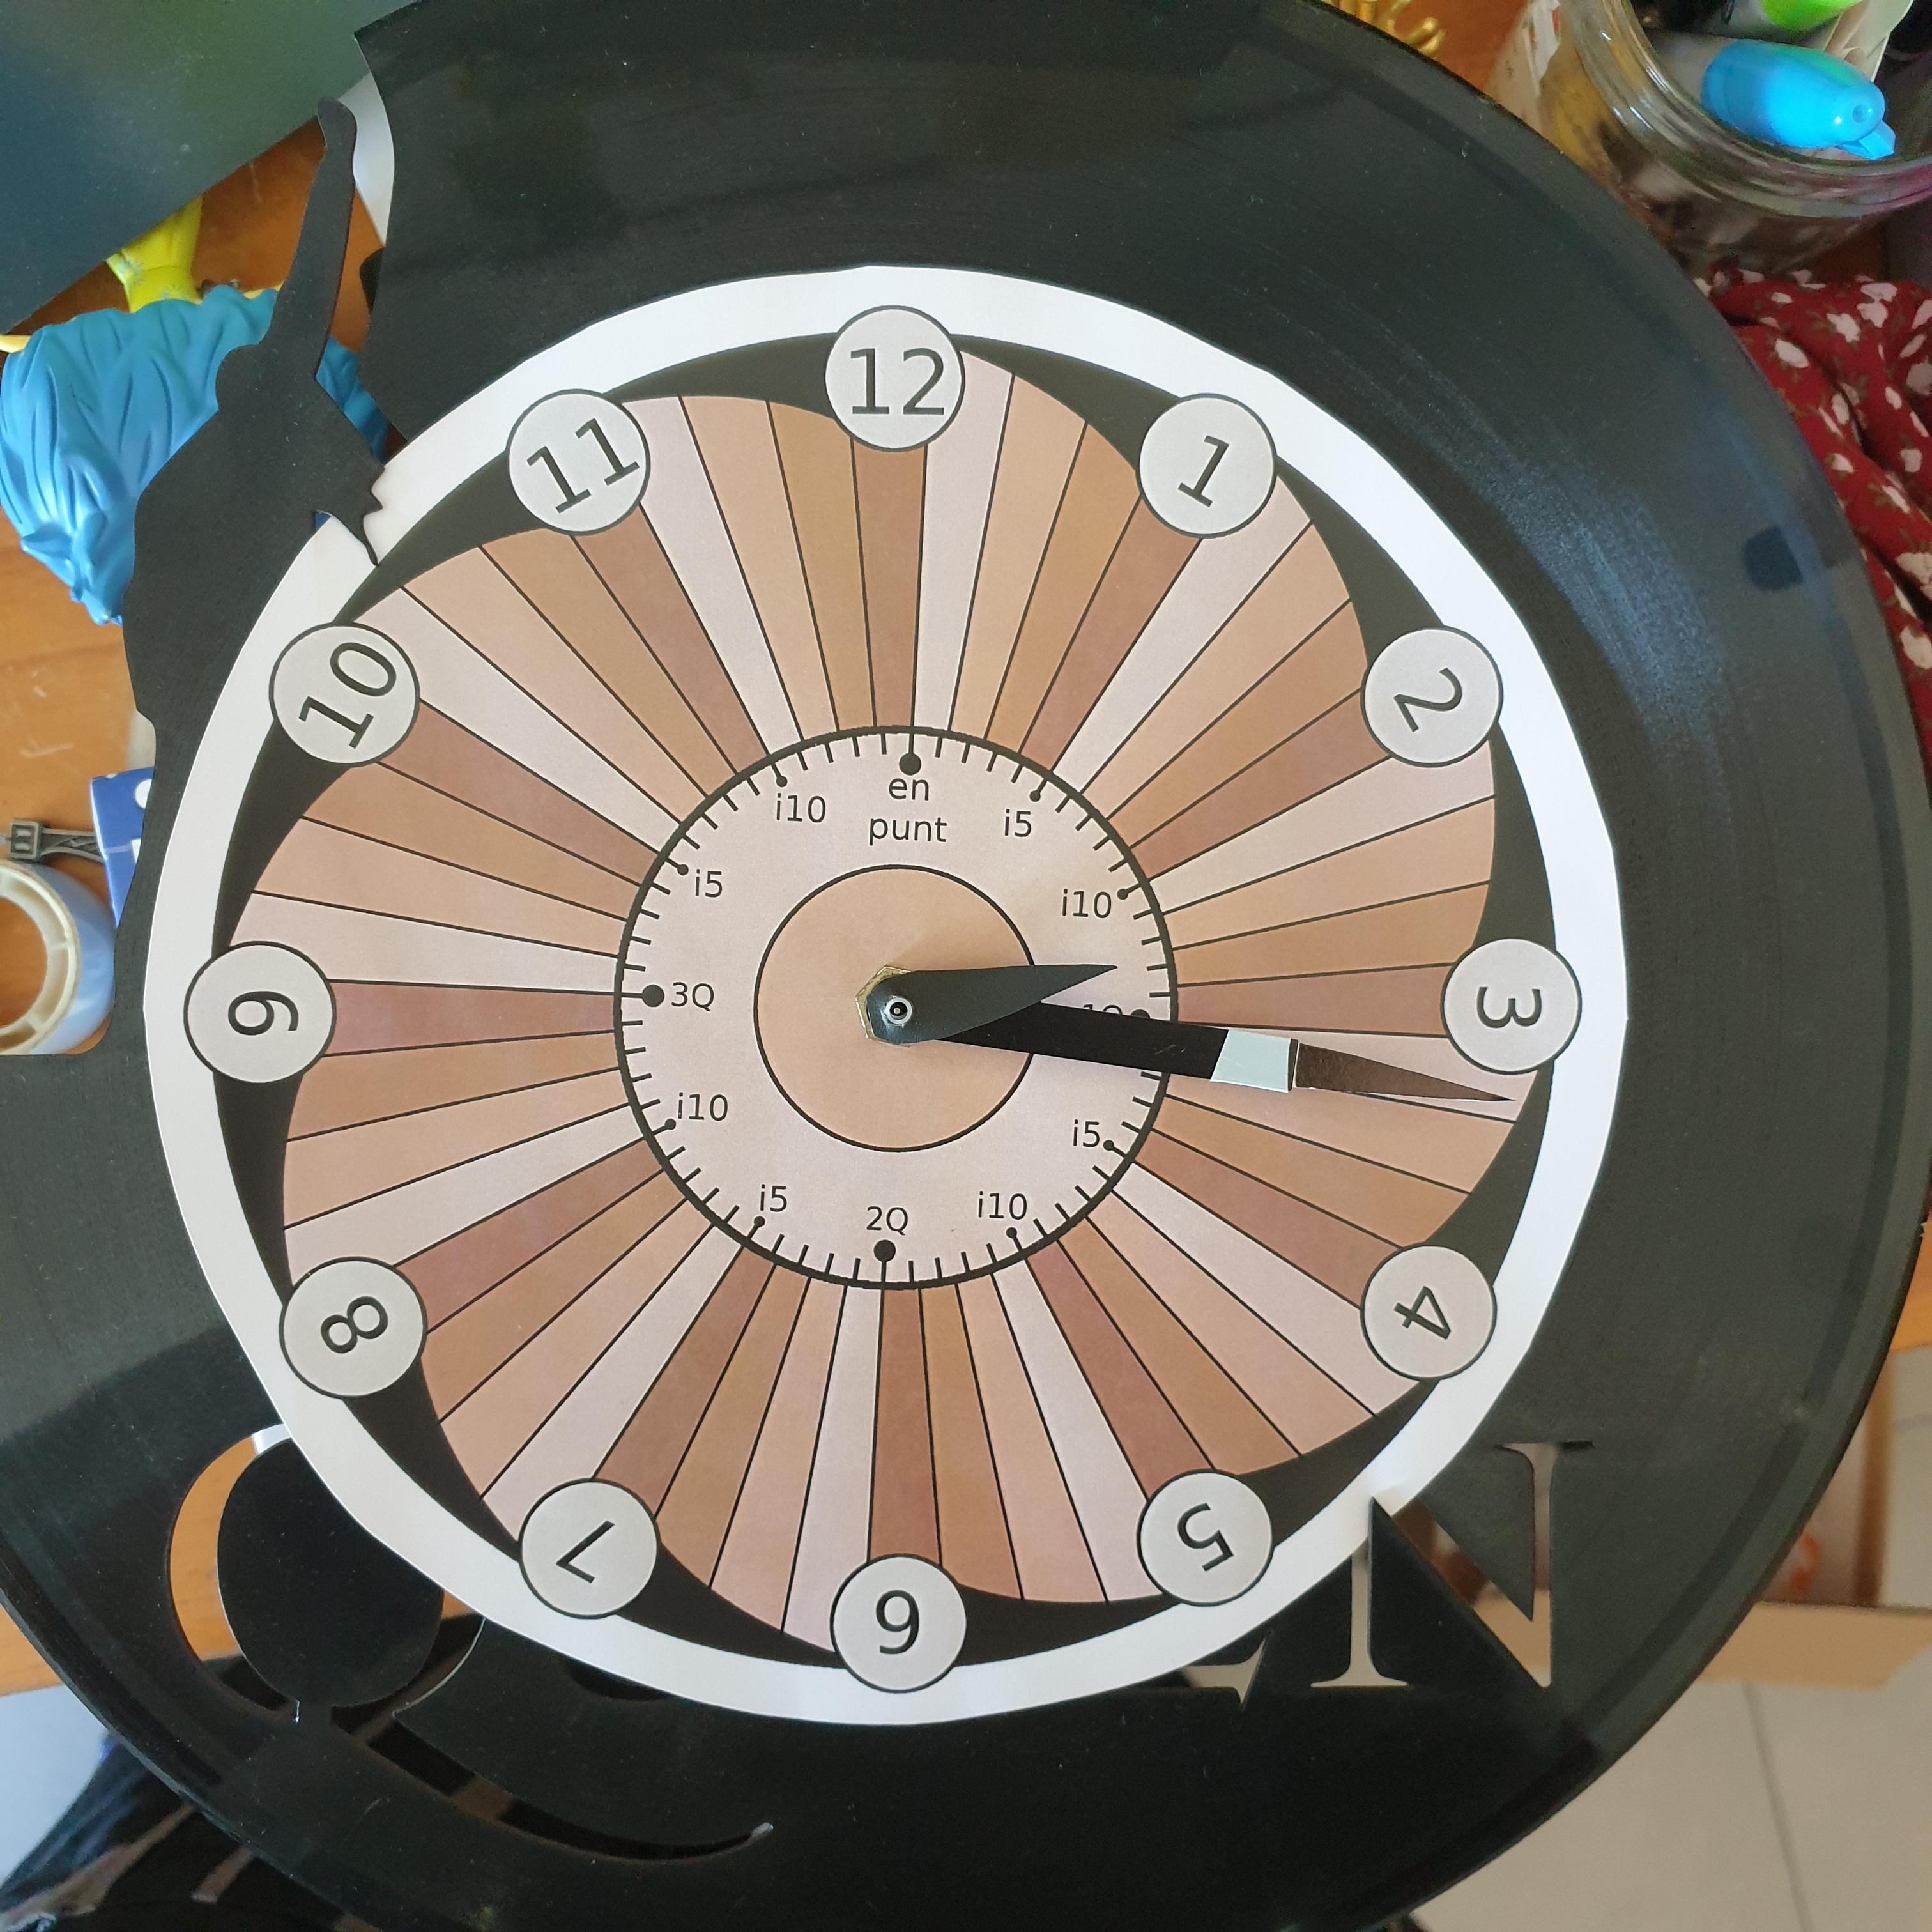
If you want to tell the time in Catalan, you should refer to the following hour (the one that's still to come), and how many minutes have passed or will pass for the closest quarter (sometimes half-quarter / mig quart [ˈmit͡ʃ kwart]) — clear as mud? It's definitely one of the more difficult things to wrap your head around as a learner. But fear not, with the power of MATLAB, we'll understand in no time!
To make a tool to tell the time in Catalan, the first thing we need to do is extract the current time into its individual hours, minutes and seconds*
function catalanTime = quinahora()
% Get the current time
[hours, minutes, seconds] = hms(datetime("now"));
% Adjust hours to 12-hour format
catalanHour = mod(hours-1, 12)+1;
nextHour = mod(hours, 12)+1;
Then to defining the numbers in catalan. It's worth noting that because the hours are feminine and the minutes are masculine, the words for 1 and 2 is different too (this is not too weird as languages go, in fact for my native Welsh there's a similar pattern between 2 and 4).
% Define the numbers in Catalan
catNumbers.masc = ["un", "dos", "tres", "quatre", "cinc"];
catNumbers.fem = ["una", "dues", "tres", "quatre",...
"cinc", "sis", "set", "vuit",...
"nou", "deu", "onze", "dotze"];
Okay, now it's starting to get serious! I mentioned before that this traditional time telling system is centred around the quarters — and that is true, but you'll also hear about the mig de quart (half of a quarter) * which is why we needed that seconds' precision from earlier!
% Define 07:30 intervals around the clock from 0 to 60
timeMarks = 0:15/2:60;
timeFraction = minutes + seconds / 60; % get the current position
[~, idx] = min(abs(timeFraction - timeMarks)); % extract the closest timeMark
mins = round(timeFraction - timeMarks(idx)); % round to the minute
After getting the fraction of the hour that we'll use later to tell the time, we can look into how many minutes it differs from that set time, using menys (less than) and i (on top of). There's also a bit of an AM/PM distinction, so you can use this function and know whether it's morning or night!
% Determine the minute string (diffString logic)
diffString = '';
if mins < 0
diffString = sprintf(' menys %s', catNumbers.masc(abs(mins)));
elseif mins > 0
diffString = sprintf(' i %s', catNumbers.masc(abs(mins)));
end
% Determine the part of the day (partofDay logic)
if hours < 12
partofDay = 'del matí'; % Morning (matí)
elseif hours < 18
partofDay = 'de la tarda'; % Afternoon (tarda)
elseif hours < 21
partofDay = 'del vespre'; % Evening (vespre)
else
partofDay = 'de la nit'; % Night (nit)
end
% Determine 'en punt' (o'clock exactly) based on minutes
enPunt = '';
if mins == 0
enPunt = ' en punt';
end
Now all that's left to do is define the main part of the string, which is which mig quart we are in. Since we extracted the index idx earlier as the closest timeMark, it's just a matter of indexing into this after the strings have been defined.
% Create the time labels
labels = {sprintf('són les %s%s%s %s', catNumbers.fem(catalanHour), diffString, enPunt, partofDay), ...
sprintf('és mig quart de %s%s %s', catNumbers.fem(nextHour), diffString, partofDay), ...
sprintf('és un quart de %s%s %s', catNumbers.fem(nextHour), diffString, partofDay), ...
sprintf('és un quart i mig de %s%s %s', catNumbers.fem(nextHour), diffString, partofDay), ...
sprintf('són dos quarts de %s%s %s', catNumbers.fem(nextHour), diffString, partofDay), ...
sprintf('són dos quarts i mig de %s%s %s', catNumbers.fem(nextHour), diffString, partofDay), ...
sprintf('són tres quarts de %s%s %s', catNumbers.fem(nextHour), diffString, partofDay), ...
sprintf('són tres quarts i mig de %s%s %s', catNumbers.fem(nextHour), diffString, partofDay), ...
sprintf('són les %s%s%s %s', catNumbers.fem(nextHour), diffString, enPunt, partofDay)};
catalanTime = labels{idx};
Then we need to do some clean up — the definite article les / la and the preposition de don't play nice with un and the initial vowel in onze, so there's a little replacement lookup here.
% List of old and new substrings for replacement
oldStrings = {'les un', 'són la una', 'de una', 'de onze'};
newStrings = {'la una', 'és la una', 'd''una', 'd''onze'};
% Apply replacements using a loop
for i = 1:length(oldStrings)
catalanTime = strrep(catalanTime, oldStrings{i}, newStrings{i});
end
end
quinahora()
So, can you work out what time it was when I made this post? 🤔
And how do you tell the time in your language?
Fins després!
I am glad to inform and share with you all my new text book titled "Inverters and AC Drives
Control, Modeling, and Simulation Using Simulink", Springer, 2024. This text book has nine chapters and three appendices. A separate "Instructor Manual" is rpovided with solutions to selected model projects. The salent features of this book are given below:
- Provides Simulink models for various PWM techniques used for inverters
- Presents vector and direct torque control of inverter-fed AC drives and fuzzy logic control of converter-fed AC drives
- Includes examples, case studies, source codes of models, and model projects from all the chapters
The Springer link for this text book is given below:
This book is also in the Mathworks book program:
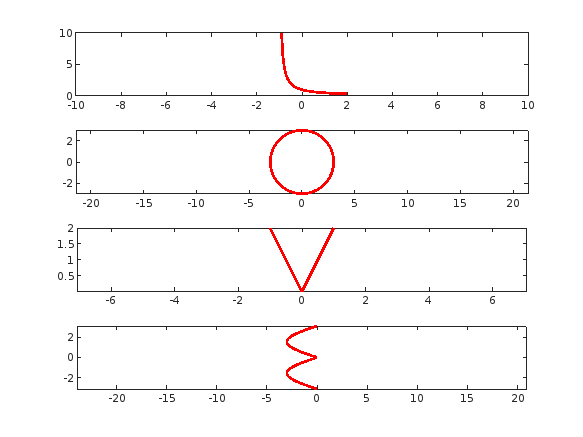
tiledlayout(4,1);
% Plot "L" (y = 1/(x+1), for x > -1)
x = linspace(-0.9, 2, 100); % Avoid x = -1 (undefined)
y =1 ./ (x+1) ;
nexttile;
plot(x, y, 'r', 'LineWidth', 2);
xlim([-10,10])
% Plot "O" (x^2 + y^2 = 9)
theta = linspace(0, 2*pi, 100);
x = 3 * cos(theta);
y = 3 * sin(theta);
nexttile;
plot(x, y, 'r', 'LineWidth', 2);
axis equal;
% Plot "V" (y = -2|x|)
x = linspace(-1, 1, 100);
y = 2 * abs(x);
nexttile;
plot(x, y, 'r', 'LineWidth', 2);
axis equal;
% Plot "E" (x = -3 |sin(y)|)
y = linspace(-pi, pi, 100);
x = -3 * abs(sin(y));
nexttile;
plot(x, y, 'r', 'LineWidth', 2);
axis equal;
I've been trying this problem a lot of time and i don't understand why my solution doesnt't work.
In 4 tests i get the error Assertion failed but when i run the code myself i get the diag and antidiag correctly.
function [diag_elements, antidg_elements] = your_fcn_name(x)
[m, n] = size(x);
% Inicializar los vectores de la diagonal y la anti-diagonal
diag_elements = zeros(1, min(m, n));
antidg_elements = zeros(1, min(m, n));
% Extraer los elementos de la diagonal
for i = 1:min(m, n)
diag_elements(i) = x(i, i);
end
% Extraer los elementos de la anti-diagonal
for i = 1:min(m, n)
antidg_elements(i) = x(m-i+1, i);
end
end
Check out the result of "emoji matrix" multiplication below.
- vector multiply vector:
a = ["😁","😁","😁"]
b = ["😂";
"😂"
"😂"]
c = a*b
d = b*a
- matrix multiply matrix:
matrix1 = [
"😀", "😃";
"😄", "😁"]
matrix2 = [
"😆", "😅";
"😂", "🤣"]
resutl = matrix1*matrix2
enjoy yourself!
For Valentine's day this year I tried to do something a little more than just the usual 'Here's some MATLAB code that draws a picture of a heart' and focus on how to share MATLAB code. TL;DR, here's my advice
- Put the code on GitHub. (Allows people to access and collaborate on your code)
- Set up 'Open in MATLAB Online' in your GitHub repo (Allows people to easily run it)
I used code by @Zhaoxu Liu / slandarer and others to demonstrate. I think that those two steps are the most impactful in that they get you from zero to one but If I were to offer some more advice for research code it would be
3. Connect the GitHub repo to File Exchange (Allows MATLAB users to easily find it in-product).
4. Get a Digitial Object Identifier (DOI) using something like Zenodo. (Allows people to more easily cite your code)
There is still a lot more you can do of course but if everyone did this for any MATLAB code relating to a research paper, we'd be in a better place I think.
Here's the article: On love and research software: Sharing code with your Valentine » The MATLAB Blog - MATLAB & Simulink
What do you think?
Los invito a conocer el libro "Sistemas dinámicos en contexto: Modelación matemática, simulación, estimación y control con MATLAB", el cual ya está disponible en formato digital.
El libro integra diversos temas de los sistemas dinámicos desde un punto de vista práctico utilizando programas de MATLAB y simulaciones en Simulink y utilizando métodos numéricos (ver enlace). Existe mucho material en el blog del libro con posibilidades para comentarios, propuestas y correcciones. Resalto los casos de estudio
Creo que el libro les puede dar un buen panorama del área con la posibilidad de experimentar de manera interactiva con todo el material de MATLAB disponible en formato Live Script. Lo mejor es que se pueden formular preguntas en el blog y hacer propuestas al autor de ejercicios resueltos.
Son bienvenidos los comentarios, sugerencias y correcciones al texto.
Simulink has been an essential tool for modeling and simulating dynamic systems in MATLAB. With the continuous advancements in AI, automation, and real-time simulation, I’m curious about what the future holds for Simulink.
What improvements or new features do you think Simulink will have in the coming years? Will AI-driven modeling, cloud-based simulation, or improved hardware integration shape the next generation of Simulink?
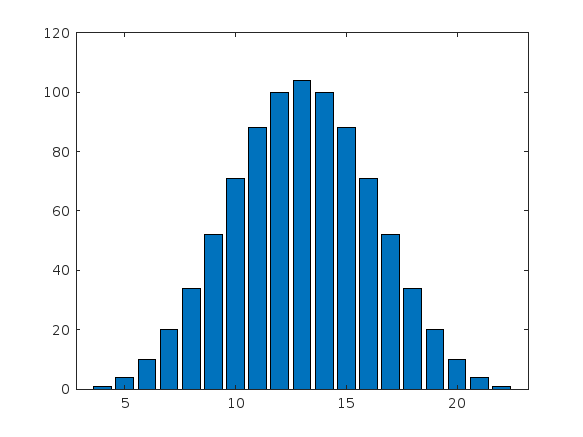
I got thoroughly nerd-sniped by this xkcd, leading me to wonder if you can use MATLAB to figure out the dice roll for any given (rational) probability. Well, obviously you can. The question is how. Answer: lots of permutation calculations and convolutions.
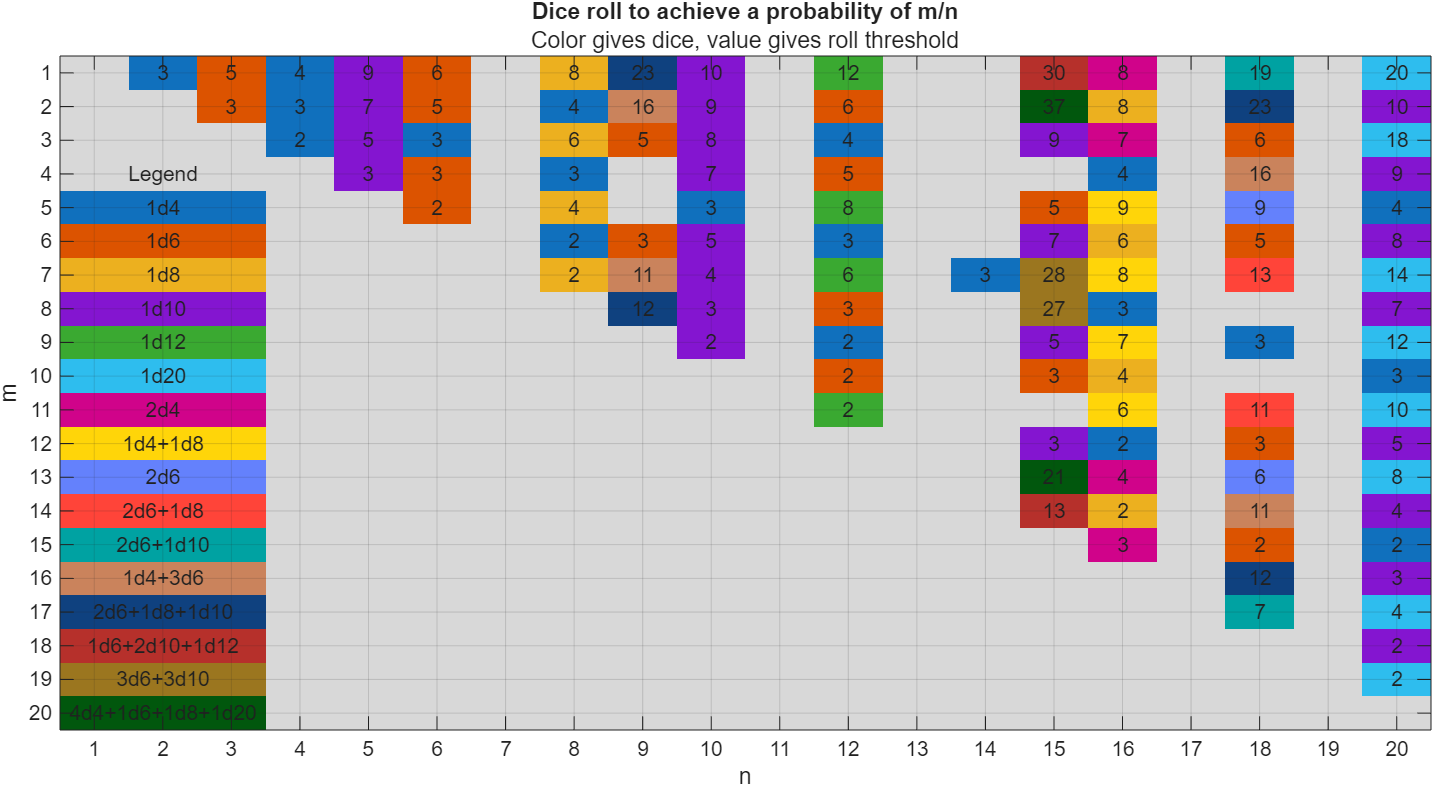
In the original xkcd, the situation described by the player has a probability of 2/9. Looking up the plot, row 2 column 9, shows that you need 16 or greater on (from the legend) 1d4+3d6, just as claimed.
If you missed the bit about convolutions, this is a super-neat trick
[v,c] = dicedist([4 6 6 6]);
bar(v,c)
% Probability distribution of dice given by d
function [vals,counts] = dicedist(d)
% d is a vector of number of sides
n = numel(d); % number of dice
% Use convolution to count the number of ways to get each roll value
counts = 1;
for k = 1:n
counts = conv(counts,ones(1,d(k)));
end
% Possible values range from n to sum(d)
maxtot = sum(d);
vals = n:maxtot;
end
I noticed recently that my data is no longer updating on thingspeak again. Is there a connectivity issues with thingspeak
my code is as below:
#include "DHT.h"
#define DHTPIN 15 // what pin we're connected to
#define DHTTYPE DHT11
DHT dht(DHTPIN, DHTTYPE);
#define THINGSPEAK_API_KEY "1P4RY69D3YMP9R5W"
#include <SoftwareSerial.h>
#include <OneWire.h>
#include <DallasTemperature.h>
//-----------------------------
#include <ArduinoJson.h>
StaticJsonDocument<200>JsonDocument;
SoftwareSerialmyserial(10, 11);
//-------------------------
float voltage;
unsignedintfrac;
//---------------------
#define ONE_WIRE_BUS 5
OneWireoneWire(ONE_WIRE_BUS);
DallasTemperaturesensors(&oneWire);
floatCelcius = 0;
float Fahrenheit = 0;
//==========================================================================================================
bytesensorInterrupt = 0; // 0 = digital pin 2
bytesensorPin = 2;
// The hall-effect flow sensor outputs approximately 4.5 pulses per second per
// litre/minute of flow.
floatcalibrationFactor = 5.5; //==========================================================we change cal factor 4.5 to 5.5 if not work chnage again(4.5)
//========== 5.5 calibration factor is working efficent then 4.5 , 7.5 ,and 6.5
volatile byte pulseCount;
floatflowRate;
unsignedintflowMilliLitres;
unsigned long totalMilliLitres, tempTotal = -1;
unsigned long oldTime;
//-------------------------------------------------------
intpH_Value;
float Voltage;
//----------------------------------------------------------------------------------------------
void setup() {
// put your setup code here, to run once:
Serial.begin(9600);
myserial.begin(9600);
//--------------------------------
pinMode(sensorPin, INPUT);
digitalWrite(sensorPin, HIGH);
pulseCount = 0;
flowRate = 0.0;
flowMilliLitres = 0;
totalMilliLitres = 0; // ============================================================
oldTime = 0;
attachInterrupt(sensorInterrupt, pulseCounter, FALLING);
sensors.begin();
//------------------------------------------------
/********************GSM Communication Starts********************/
if (myserial.available())
Serial.write(myserial.read());
myserial.println("AT");
delay(1000);
myserial.println("AT+SAPBR=3,1,\"Contype\",\"GPRS\"");
delay(1000);
ShowSerialData();
myserial.println("AT+SAPBR=3,1,\"APN\",\"www\"");//APN
delay(1000);
ShowSerialData();
myserial.println("AT+SAPBR=1,1");
delay(1000);
ShowSerialData();
myserial.println("AT+SAPBR=2,1");
delay(1000);
ShowSerialData();
//---------------------------------
}
void loop() {
// put your main code here, to run repeatedly:
inti;
for (i = 0; i< 20; i++)
{
flow_meter();
}
temperature();
turbidity();
delay(1000);
gsm();
}
voidflow_meter()
{
if ((millis() - oldTime) > 1000) // Only process counters once per second
{
// Disable the interrupt while calculating flow rate and sending the value to
// the host
detachInterrupt(sensorInterrupt);
// Because this loop may not complete in exactly 1 second intervals we calculate
// the number of milliseconds that have passed since the last execution and use
// that to scale the output. We also apply the calibrationFactor to scale the output
// based on the number of pulses per second per units of measure (litres/minute in
// this case) coming from the sensor.
flowRate = ((1000.0 / (millis() - oldTime)) * pulseCount) / calibrationFactor;
// Note the time this processing pass was executed. Note that because we've
// disabled interrupts the millis() function won't actually be incrementing right
// at this point, but it will still return the value it was set to just before
// interrupts went away.
oldTime = millis();
// Divide the flow rate in litres/minute by 60 to determine how many litres have
// passed through the sensor in this 1 second interval, then multiply by 1000 to
// convert to millilitres.
flowMilliLitres = (flowRate / 60) * 1000;
// Add the millilitres passed in this second to the cumulative total
totalMilliLitres += flowMilliLitres;
// Print the flow rate for this second in litres / minute
/* Serial.print("Flow rate: ");
Serial.print(int(flowRate)); // Print the integer part of the variable
Serial.print("."); // Print the decimal point */
// Determine the fractional part. The 10 multiplier gives us 1 decimal place.
frac = (flowRate - int(flowRate)) * 10;
Serial.print(frac, DEC) ; // Print the fractional part of the variable
Serial.println("L/min");
/* // Print the number of litres flowed in this second
Serial.print(" Current Liquid Flowing: "); // Output separator
Serial.print(flowMilliLitres);
Serial.print("mL/Sec");
// Print the cumulative total of litres flowed since starting
Serial.print(" Output Liquid Quantity: "); // Output separator
Serial.print(totalMilliLitres);
Serial.println("mL"); */
if ( tempTotal != totalMilliLitres ) {
tempTotal = totalMilliLitres;
// displayVolumeOfWater(totalMilliLitres );
}
// Reset the pulse counter so we can start incrementing again
pulseCount = 0;
// Enable the interrupt again now that we've finished sending output
attachInterrupt(sensorInterrupt, pulseCounter, FALLING);
}
//=========================================================================================================================
}
voidpulseCounter()
{
// Increment the pulse counter
pulseCount++;
}
//-------------------------------------------------------------------------
void temperature()
{
sensors.requestTemperatures();
Celcius = sensors.getTempCByIndex(0);
Fahrenheit = sensors.toFahrenheit(Celcius);
Serial.print(" C ");
Serial.print(Celcius);
// Serial.print(" F ");
// Serial.println(Fahrenheit);
delay(1000);
}
//------------------------------------------------------------
void turbidity()
{
intsensorValue = analogRead(A0);
voltage = sensorValue * (5.0 / 1024.0);
// Serial.println ("Sensor Output (V):");
Serial.println (voltage);
// Serial.println();
delay(1000);
}
//------------------------------------------------------------
voidgsm()
{
myserial.println("AT+HTTPINIT");
delay(1000);
ShowSerialData();
myserial.println("AT+HTTPPARA=\"CID\",1");
delay(1000);
ShowSerialData();
StaticJsonDocument<200>JsonDocument;
JsonObject& object = JsonDocument.createObject();
object.set("TE", Celcius);
object.set("TU", voltage);
object.set("WF", frac);
delay(1000);
object.printTo(Serial);
Serial.println(" ");
String sendtoserver;
object.prettyPrintTo(sendtoserver);
delay(1000);
//myserial.println("AT+HTTPPARA=\"URL\",\"https://api.thingspeak.com/update?api_key=\""); //Server address
myserial.println("AT+HTTPPARA=\"URL\",\"https://api.thingspeak.com/update?api_key=\""); //Server address
delay(1000);
ShowSerialData();
myserial.println("AT+HTTPPARA=\"CONTENT\",\"application/json\"");
delay(1000);
ShowSerialData();
myserial.println("AT+HTTPDATA=" + String(sendtoserver.length()) + ",100000");
Serial.println(sendtoserver);
delay(1000);
ShowSerialData();
myserial.println(sendtoserver);
delay(2000);
ShowSerialData;
myserial.println("AT+HTTPACTION=1");
delay(1000);
ShowSerialData();
myserial.println("AT+HTTPREAD");
delay(1000);
ShowSerialData();
myserial.println("AT+HTTPTERM");
delay(1000);
ShowSerialData;
}
voidShowSerialData()
{
while (myserial.available() != 0)
Serial.write(myserial.read());
delay(1000);
}
I am very pleased to share my book, with coauthors Professor Richard Davis and Associate Professor Sam Toan, titled "Chemical Engineering Analysis and Optimization Using MATLAB" published by Wiley: https://www.wiley.com/en-us/Chemical+Engineering+Analysis+and+Optimization+Using+MATLAB-p-9781394205363
Also in The MathWorks Book Program:
Chemical Engineering Analysis and Optimization Using MATLAB® introduces cutting-edge, highly in-demand skills in computer-aided design and optimization. With a focus on chemical engineering analysis, the book uses the MATLAB platform to develop reader skills in programming, modeling, and more. It provides an overview of some of the most essential tools in modern engineering design.
Chemical Engineering Analysis and Optimization Using MATLAB® readers will also find:
- Case studies for developing specific skills in MATLAB and beyond
- Examples of code both within the text and on a companion website
- End-of-chapter problems with an accompanying solutions manual for instructors
This textbook is ideal for advanced undergraduate and graduate students in chemical engineering and related disciplines, as well as professionals with backgrounds in engineering design.
You've probably heard about the DeepSeek AI models by now. Did you know you can run them on your own machine (assuming its powerful enough) and interact with them on MATLAB?
In my latest blog post, I install and run one of the smaller models and start playing with it using MATLAB.
Larger models wouldn't be any different to use assuming you have a big enough machine...and for the largest models you'll need a HUGE machine!
Even tiny models, like the 1.5 billion parameter one I demonstrate in the blog post, can be used to demonstrate and teach things about LLM-based technologies.
Have a play. Let me know what you think.