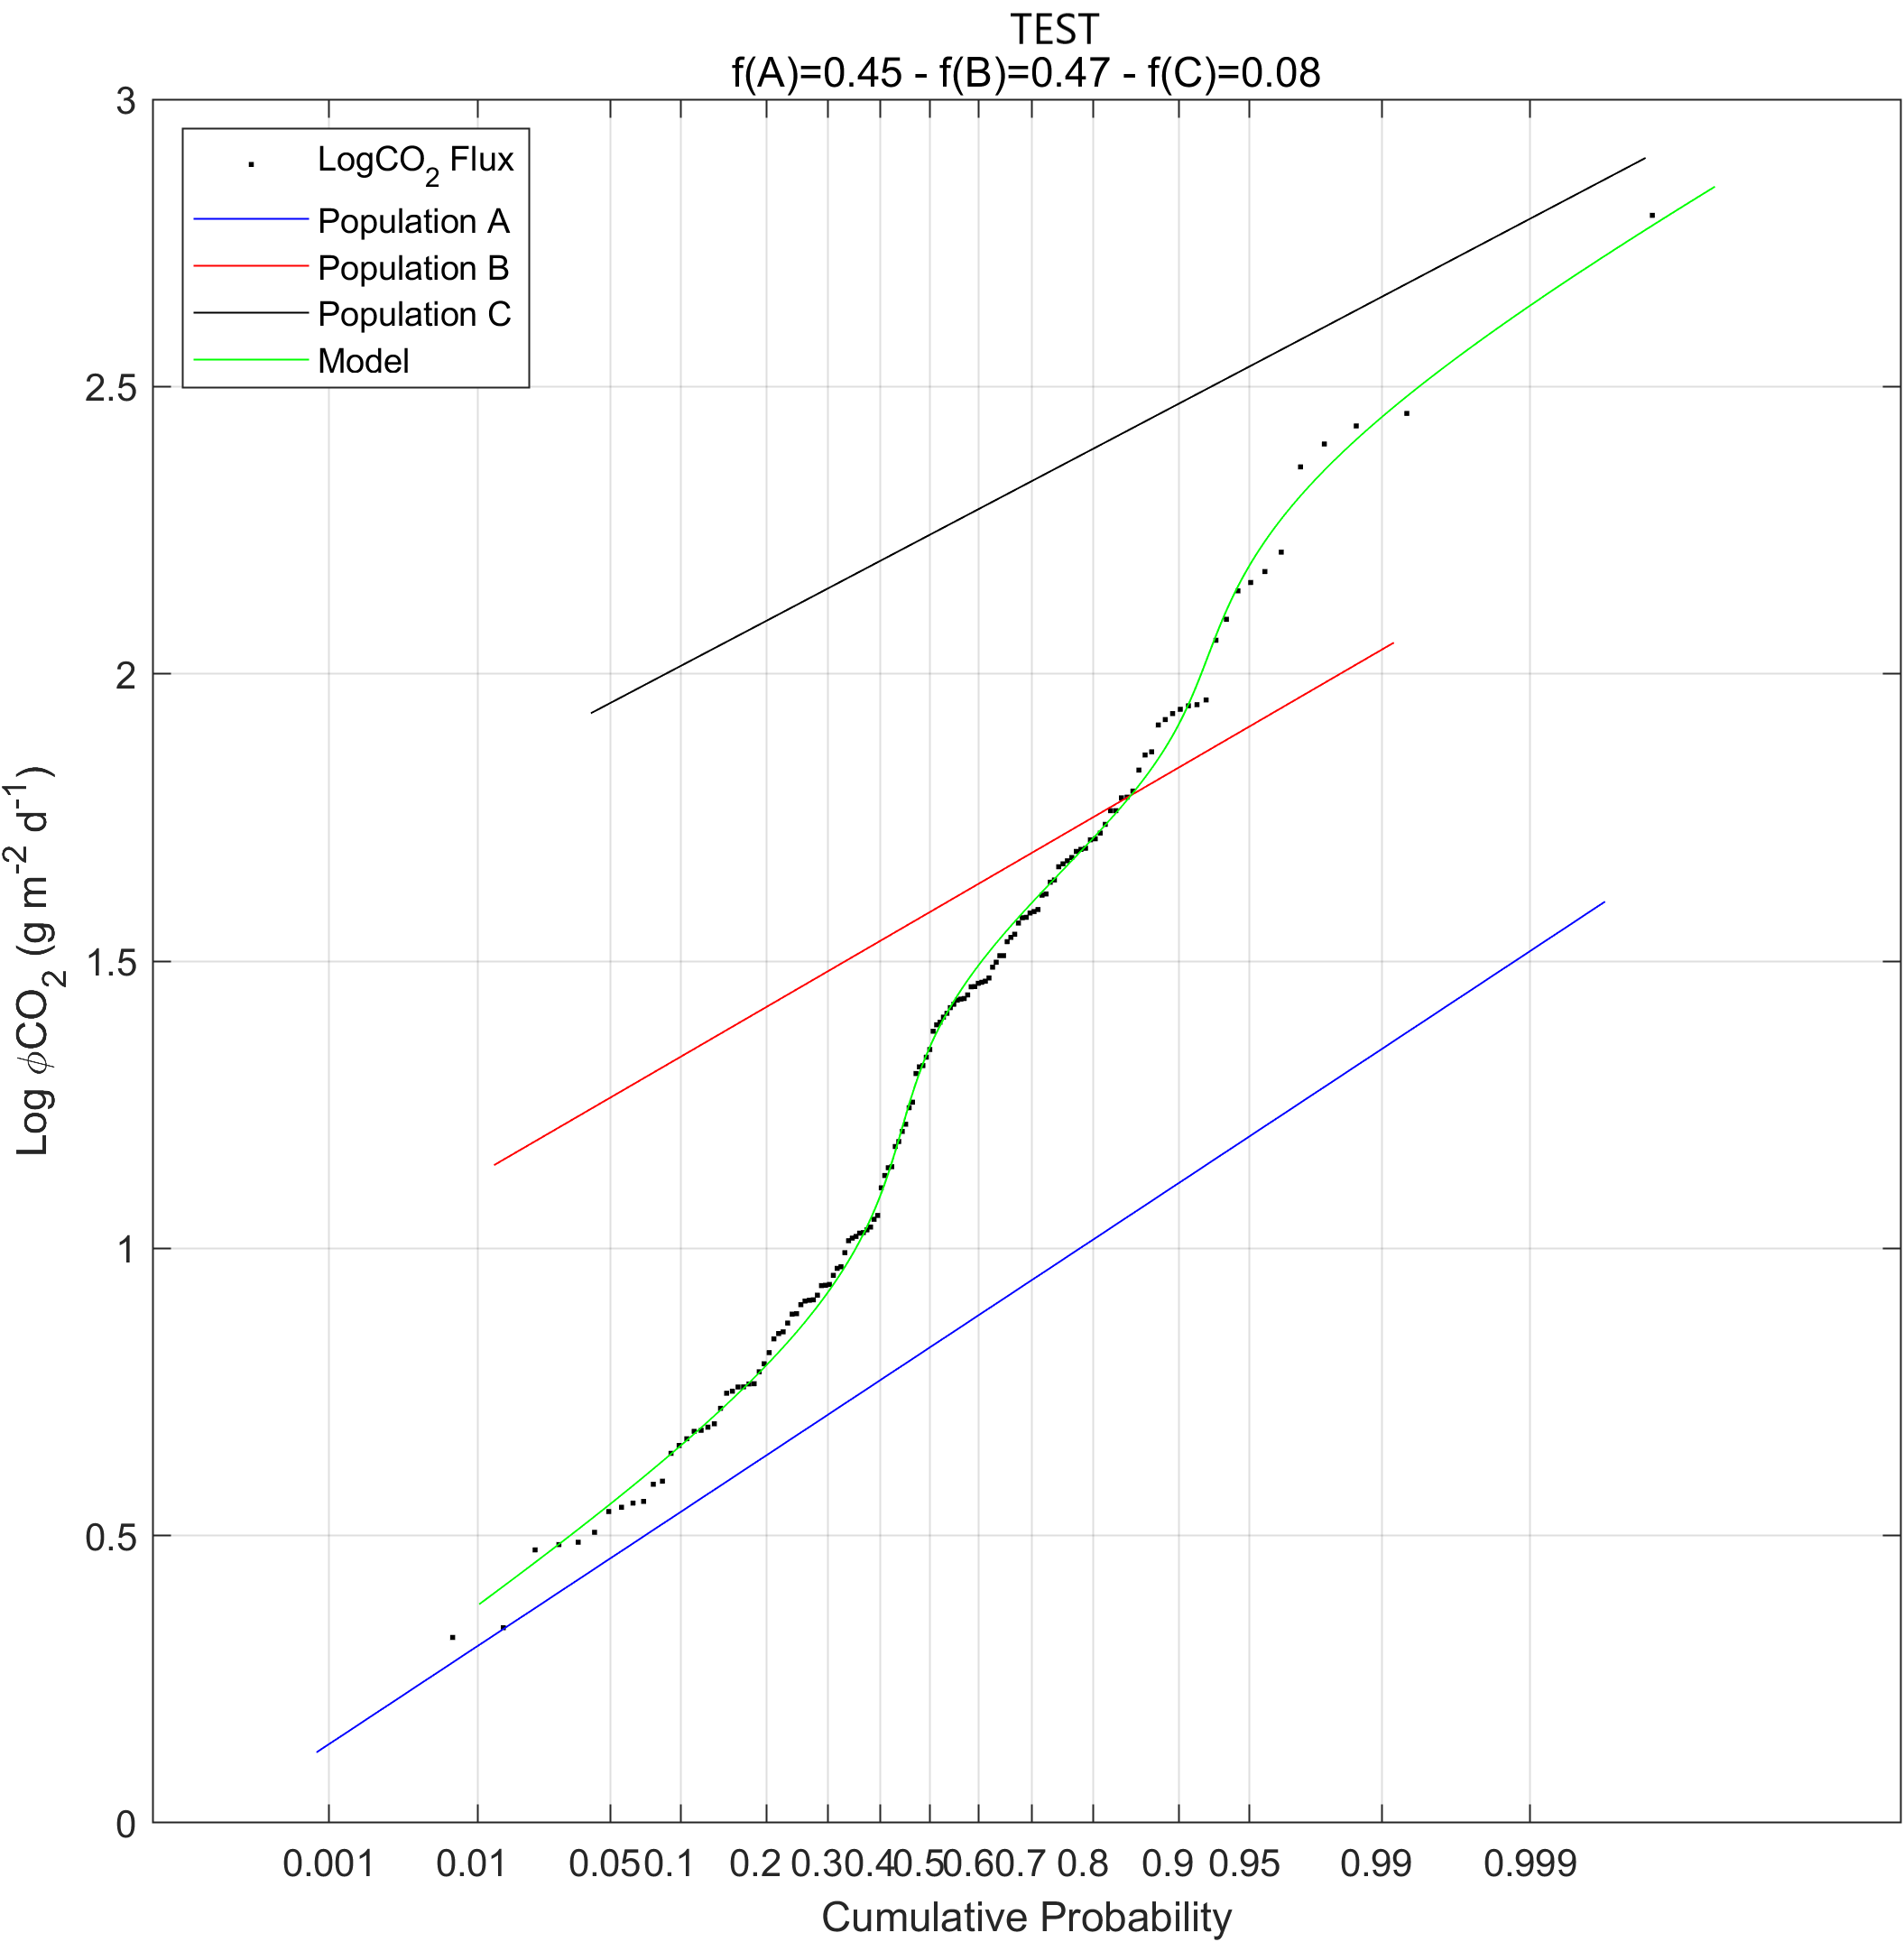
Graphical Statistical Analysis Tool
The GSAT allows to identify and separate the different lognormal populations that contribute to a natural distribution of geochemical data.

You are now following this Submission
- You will see updates in your followed content feed
- You may receive emails, depending on your communication preferences
Cite As
Lorenzo Cappelli (2026). Graphical Statistical Analysis Tool (https://ch.mathworks.com/matlabcentral/fileexchange/122017-graphical-statistical-analysis-tool), MATLAB Central File Exchange. Retrieved .
General Information
- Version 1.0.3 (804 KB)
MATLAB Release Compatibility
- Compatible with any release
Platform Compatibility
- Windows
- macOS
- Linux
| Version | Published | Release Notes | Action |
|---|---|---|---|
| 1.0.3 | The new release allows importing the fitting limits for populations and the model from previous files or modifying them directly from the proper popup window. |
||
| 1.0.2 | Fixed file name error. Enlarged font and markers in plots. Allowed automatic uploading of fit limits from previous result files. |
||
| 1.0.1 | The code has been optimized for four population distributions. |
||
| 1.0.0 |

