
pstest_stm32f746g_discovery_unmanaged

This demo contains an STM32CubeIDE project that is set up to do the following:
- Run some sample C/C++ tests written using the Polyspace Test xUnit API on an STM32F746G Discovery board
- Collect coverage data after test execution using the polyspace-code-profiler command (available with Polyspace Test).
The demo assumes the following:
- You have a STM32F746G Discovery board connected to your computer.
- You have installed the STM32Cube IDE.
- You have installed the Polyspace Test product.
To adapt the project to your Polyspace Test installation and run the tests or get coverage results, download the project and follow these steps:
-
Download the demo and extract into a folder
nchatela-pstest_stm32f746g_discovery_unmanaged-4055114. -
Open the STM32CubeIDE interface. Select File > Open Projects from File System.
Add the path to the foldernchatela-pstest_stm32f746g_discovery_unmanaged-4055114to the Import Source field.
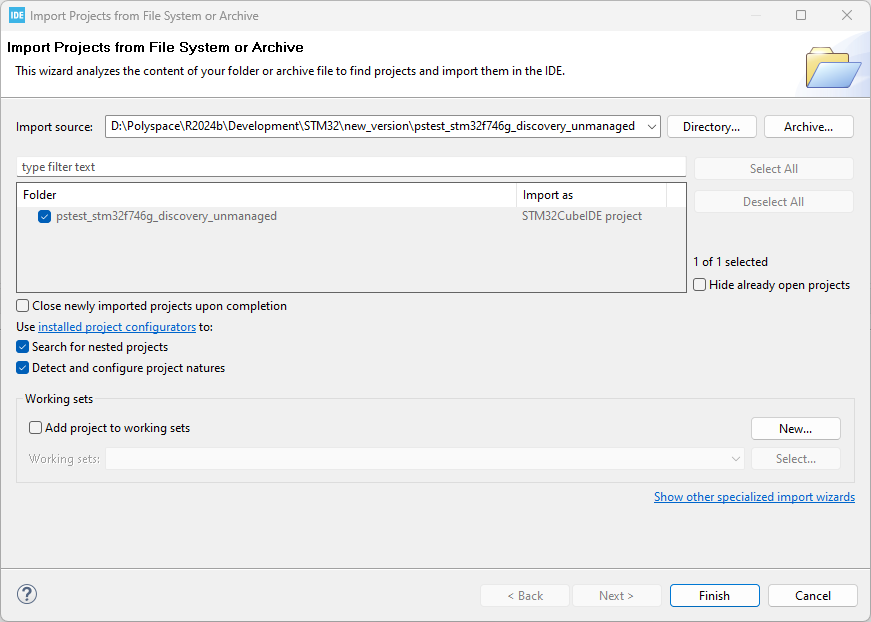
-
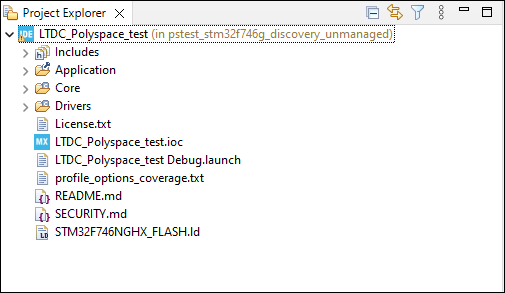
Click Finish. On the Project Explorer pane, you see a project with these folders:

- Application: This folder contains the sources, tests written using the Polyspace Test xUnit API, and files required for collecting coverage.
-
Core: Contains the
mainfunction, and specific libraries to drive the lcd screen. -
Drivers: Contains the strandard Hardware abstraction layer of STM32.
This project has been created by adapting an example STM32CubeIDE project to run tests and collect coverage data. The adaptations are described in the next section.

-
Modify the project properties to point to your Polyspace Test installation. On the Project Explorer pane, right-click the project node and select Properties.
-
On the Properties window:
- Select Resource > Linked Resources.
Change the value of the variable
PSTEST, which is currently set toC:\Program Files\Polyspace\R2023b, to your Polyspace installation folder. - Select C/C++ Build > Environment.
Change the value of the variable
PSTESTto your Polyspace installation folder.
-
Click the Debug icon
 to build the project and start executon on the STM32F746G board. Alternatively, you can right-click the root node of the project and select Build Project, and after build is over, right-click and select Debug As > STM32 Application.
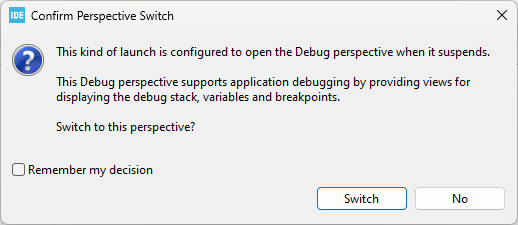
If prompted to switch to the Debug perspective, select Switch.
to build the project and start executon on the STM32F746G board. Alternatively, you can right-click the root node of the project and select Build Project, and after build is over, right-click and select Debug As > STM32 Application.
If prompted to switch to the Debug perspective, select Switch.
-
Click the Resume icon
 to resume the application on the STM32F746G board.
The results of test execution appear on the LCD screen of the board. -
This project is set up to collect coverage data after execution on target. To log the coverage data, you can use a terminal emulator like Tera Term.


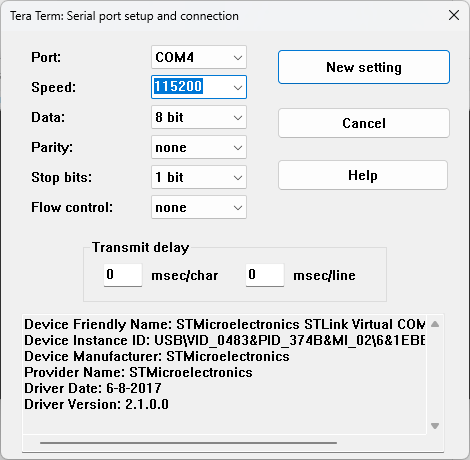
- Open a new connection in Tera Term to receive data from the STM32F746G board over a serial port.
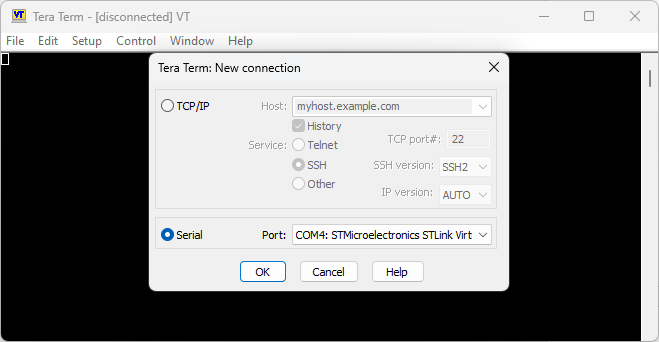
- Set up your serial port connection to a baud rate of 115200. In Tera Term, you can do this by selecting Setup > Serial Port. Set Speed to 115200 and then click New Setting to save this setting.
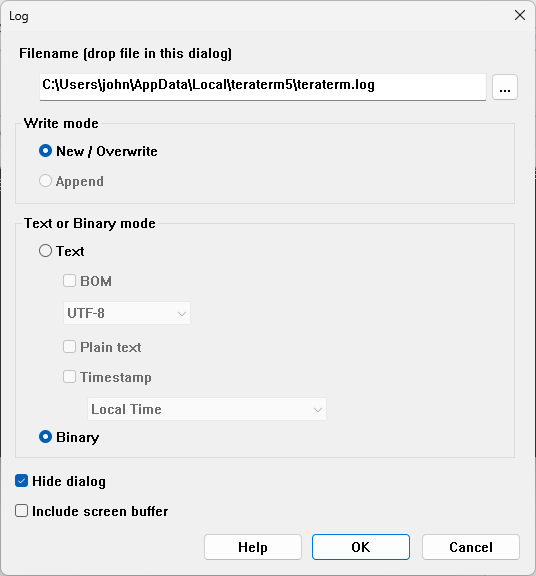
- Log the data in binary form. In Tera Term, you can do this by selecting File > Log. In the log settings, note the log file location. In the section Text or Binary mode, select Binary, and then click OK.
- In the STM32CubeIDE, repeat steps 6 and 7. Once you see the results on test execution on the LCD screen of the board, stop logging. In Tera Term, you can do this by selecting File > Stop Logging.


- Convert the log file generated in the previous step into a
.binfile. For example, if your log file is namedteraterm.log, in Windows, at the command line, rename it by using this command:
move teraterm.log teraterm.bin
- To open the coverage results in the Polyspace Platform user interface, convert the
.binfile into a.psproffile using thepolyspace-code-profilerorpolyspace-testcommand. For example, to convert the fileteraterm.bin, enter this command at the command line:
polyspace-code-profiler -convert -instrum-dir instrumDir -results-dir resDir teraterm.bin
You can then open the .psprof file in the Polyspace Platform user interface and review the coverage results. For more information, see Review C/C++ Coverage Metrics.
For more information on the commands used, see:
This project is adapted from a standard STM32CubeIDE project to make it suitable for coverage data collection. This section describes the adaptations in some detail. You can make similar adaptations to your own projects for running tests on an STM32 development board, and collecting coverage.
Since the execution of user code begins from the main() function, to understand how the project is set up, you can begin exploring from the main().
- On the Project Explorer pane, open the file Core > Src > main.c.
- In the body of the
main()function, note the following lines or their equivalent. These lines are used to execute the tests registered via the registration functionregisterTests. The registration function is defined in the test files (see later).
  PST_REGFCN_CALL(registerTests);
  PST_MAIN(0, NULL);
- Note the call to the
psprofile_stream()function following the test execution. This function triggers streaming of code coverage data after test execution on target.
For more information on test registration, see Write C or C++ Unit Test Using Polyspace Test xUnit API and Run Tests at Command Line .
This project contains some simple source files in the folder Application\sources. To see that the folder Application has been included in the build:
-
On the Project Explorer pane, right-click the project node and select Properties.
-
Select C/C++ General > Paths and Symbols. On the Source Location tab, you can see which folders are included in the build.
The source files include a header that is in the subfolder Application\inc.
The functions in the folder Application\sources are tested using xUnit tests in the folder Application\tests.
Open the file profilingTests.c to see examples of tests written using the Polyspace Test xUnit API. The tests use macros declared in the header pstunit.h available in a Polyspace Test installation. The path to this header is included as an include path during project build (see later).
For more information on the xUnit API, see Author Tests Using C/C++ xUnit API .
To display test execution results on the LCD screen of the board, additional customization is required. This customization is done using files pstunit_config.c and pstunit_config.h in the folder Application\pstest_configuration.
The header file pstunit_config.h defines these macros:
-
PST_OUTPUTis set toPST_OUTPUT_TABLEto output results in a tabular format on the LCD screen. For more information on result formats, see Results Format of Tests Written Using Polyspace Test API . -
PST_WRITE,PST_FLUSH, andPST_PRINTFare set to functions that stream data to the LCD screen. The functions are defined in the filepstunit_config.c.
To make sure that these configuration files are used during test execution, the preprocessor define PST_USER_CONFIG_FILE is added during project build (see later).
To stream coverage data from the board back to the host, additional customization is required. This customization is done using files psprofile_config.c and psprofile_config.h in the folder Application\pstest_configuration. These files use macros defined in the file psprofile_internal.c (available with a Polyspace Test installation and added as a linked resource in the project in the folder Application\pstest_configuration).
The header file psprofile_config.h defines these macros:
-
PSPROFILE_SENDING_TYPEis set to 2. This requires you to define your own functions for initiating a connection between host and target, and streaming data. -
PSPROFILE_SENDING_INIT,PSPROFILE_SENDING_DATA_ASYNC,PSPROFILE_SENDING_DATA_WAIT, andPSPROFILE_SENDING_ENDare set to functions that initiate a connection between host and target, and stream coverage data from the target back to the host. The functions are defined in the filepstprofile_config.c. -
PSPROFILE_EXECPROF_AVAILABLEis defined andPSPROFILE_GET_TIMESTAMPis set to a counter function that allows execution profiling. To perform execution profiling instead of coverage calculation, you have to replace-cov-metric-level mcdcin the options fileprofile_options_coverage.txtwith-exec-metric-level standard(for more information on the options file for coverage, see later). -
PSPROFILE_STACKPROF_AVAILABLEis defined andPSPROFILE_GET_STACKPTRis set to a function that returns the current stack pointer and allows memory profiling. To perform memory profiling instead of coverage calculation, you have to replace-cov-metric-level mcdcin the options fileprofile_options_coverage.txtwith-stack-metric-level standard(for more information on the options file for coverage, see later).
To make sure that these files are used during test execution, the preprocessor define PST_USER_CONFIG_FILE is added during project build (see later).
The test files and configuration files added to the project use macros that are available with a Polyspace Test installation. To make sure that the macro definitions are available during project build, the project properties have been modified appropriately. To see the modifications:
-
On the Project Explorer pane, right-click the project node and select Properties.
-
Select C/C++ Build > Settings.
On the Tool Settings tab, select MCU GCC Compiler. You can see the following entry for Command line pattern. The part following--is the actual build command while the part preceding--uses the build command to instrument source files for coverage (and later runs the build command with instrumented sources to create the test executable).
"${PSTEST}/polyspace/bin/polyspace-code-profiler.exe" -instrument -options-file ../profile_options_coverage.txt -- ${COMMAND} ${INPUTS} ${FLAGS} ${OUTPUT_FLAG} ${OUTPUT_PREFIX}${OUTPUT}
- On the Tool Settings tab, select MCU GCC Compiler > Include paths. You can see the following include paths added to the project (in addition to other paths). These paths enable inclusion of header files shipped with a Polyspace Test installation. Note the use of the variable
PSTESTthat you had changed in the earlier section to point to your Polyspace installation folder.
"${PSTEST}/polyspace/pstest/pstunit/include""${PSTEST}/polyspace/pstest/pstunit/src""${PSTEST}/polyspace/psprofile/include"
- On the Tool Settings tab, select MCU GCC Compiler > Preprocessor. You can see the preprocessor define
PST_USER_CONFIG_FILE. This macro allows the configuration files for tests and profiling to be used during project build.
The command polyspace-code-profiler that runs during project build uses an options file profile_options_coverage.txt to instrument the sources for coverage calculation. This file is stored in the root folder of the project.
The options file uses these options:
-
-limit-instrumentation-toto limit instrumentation to source files only. -
-instrum-dirto store the results in a folderinstrumDirthat is part of the project. -
-cov-metric-levelto specify what coverage level is desired. You can change this option to-exec-metric-levelorstack-metric-levelto perform execution or memory profiling of the sources.
For more information on the options, see polyspace-code-profiler.
Cite As
Nicolas Chatelain (2024). pstest_stm32f746g_discovery_unmanaged (https://github.com/nchatela/pstest_stm32f746g_discovery_unmanaged), GitHub. Retrieved .
MATLAB Release Compatibility
Platform Compatibility
Windows macOS LinuxTags
Community Treasure Hunt
Find the treasures in MATLAB Central and discover how the community can help you!
Start Hunting!Discover Live Editor
Create scripts with code, output, and formatted text in a single executable document.
Versions that use the GitHub default branch cannot be downloaded
| Version | Published | Release Notes | |
|---|---|---|---|
| 1.0.0 |
|
You can also select a web site from the following list
Americas
- América Latina (Español)
- Canada (English)
- United States (English)
Europe
- Belgium (English)
- Denmark (English)
- Deutschland (Deutsch)
- España (Español)
- Finland (English)
- France (Français)
- Ireland (English)
- Italia (Italiano)
- Luxembourg (English)
- Netherlands (English)
- Norway (English)
- Österreich (Deutsch)
- Portugal (English)
- Sweden (English)
- Switzerland
- United Kingdom (English)
Asia Pacific
- Australia (English)
- India (English)
- New Zealand (English)
- 中国
- 日本Japanese (日本語)
- 한국Korean (한국어)