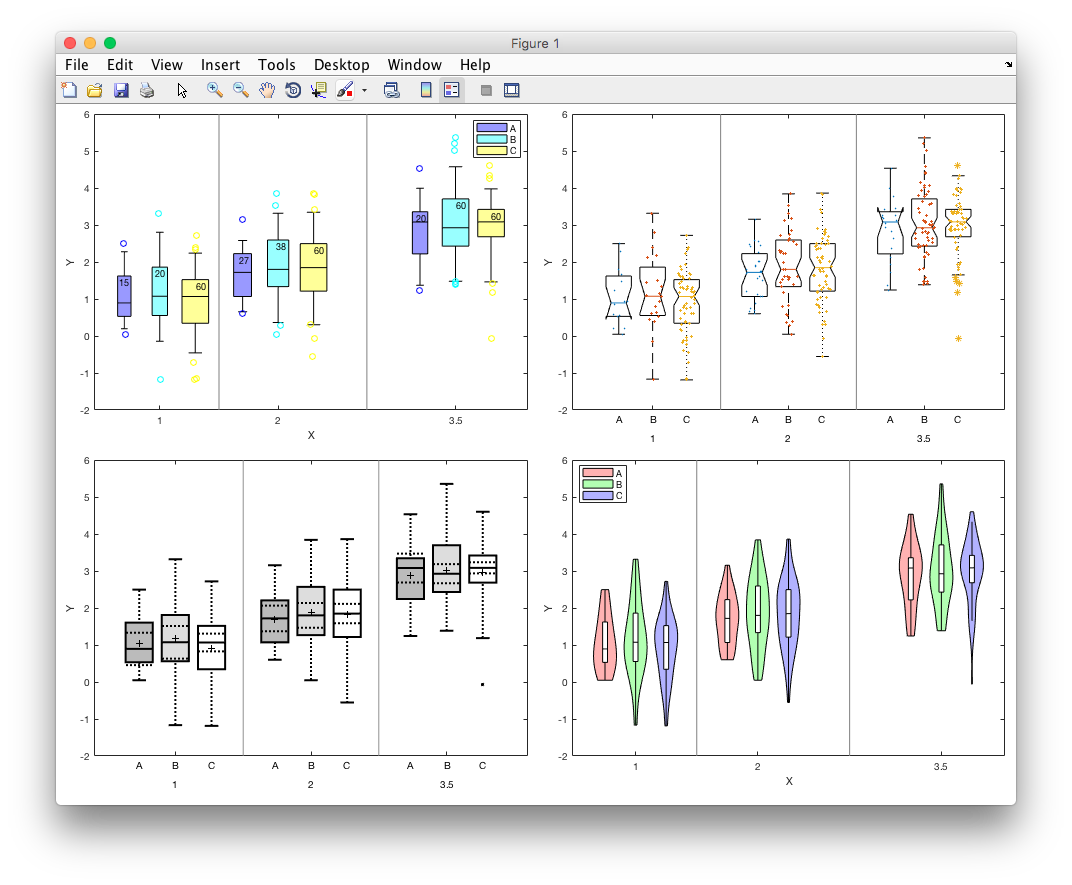
Alternative box plot
Draw a box plot with various display options

You are now following this Submission
- You will see updates in your followed content feed
- You may receive emails, depending on your communication preferences
Editor's Note: This file was selected as MATLAB Central Pick of the Week
Cite As
Christopher Hummersone (2026). Alternative box plot (https://github.com/IoSR-Surrey/MatlabToolbox), GitHub. Retrieved .
Acknowledgements
Inspired by: notBoxPlot, Hierarchically grouped boxplot
General Information
- Version 3.2.1 (156 KB)
-
 View License on GitHub
MATLAB Release Compatibility
- Compatible with any release
Platform Compatibility
- Windows
- macOS
- Linux
| Version | Published | Release Notes | Action |
|---|---|---|---|
| 3.2.1 | Function now natively supports sub-groups, handles NaNs more robustly, and returns sample size(s). A few other minor tweaks and doc changes. |
||
| 3.1.0 | Added 'theme' property to allow multiple display properties to be changed simultaneously. Various bug fixes. |
||
| 3.0.2 | More bug fixes. Forced legend alpha to match box alpha. |
||
| 3.0.1 | Added ability to specify colors as a colormap function. Changed some size properties to no longer be specifiable for each group. Bug fixes. |
||
| 3.0.0 | Re-implemented function as a class (with a new name). Added property to automate construction of a legend. |
||
| 2.0.8 | Added meanSize property. |
||
| 2.0.7 | Corrected calculation of mean when data include NaN. Updated picture. |
||
| 2.0.6 | Added options for displaying the means. |
||
| 2.0.5 | Added trap for MarkerEdgeAlpha (scatterAlpha), which older versions of Matlab do not support. |
||
| 2.0.4 | Added layer and transparency options. |
||
| 2.0.3 | Fixed automatic placement of boxes. |
||
| 2.0.2 | Corrected bug where x offset was erroneous if y was not hierarchical. |
||
| 2.0.1 | Small tweaks to improve robustness. |
||
| 2.0.0 | Numerous changes to interface in order to support multidimensional data and improve hierarchical data labelling. Added scaleWidth option to scale box widths according to sample size. |
||
| 1.6.3 | Added x-shaping to outliers and tweaked offset distribution. |
||
| 1.6.2 | Added x shaping for overlayed scatter plots whereby the random x offset is related to the data distribution. Fixed bug whereby xSeparator handle would be sought even if xSeparator was not specified. |
||
| 1.6.1 | Shuffled a few things around so that the creation order defines the layering, rather than relying on uistack(). Added linkprop() and listener to keep axes in sync and to change xseparator if ylim changes. |
||
| 1.6.0 | Forgot to include tab2box. |
||
| 1.5.1 | Fixed bug where x is a cell array of strings. |
||
| 1.5.0 | Remove NaN from x data (and corresponding y data). |
||
| 1.4.1 | Updated documentation. |
||
| 1.4.0 | Improved robustness to small or empty samples. Add tab2box function for arranging tabular into the format accepted by box_plot. |
||
| 1.3.0 | Function now natively supports sub-groups, handles NaNs more robustly, and returns sample size(s). A few other minor tweaks and doc changes. |
||
| 1.2.0 | Moved quantile calculation to new function. |
||
| 1.1.0 | Changed/corrected quantile estimation algorithm. Details in help text. |
||
| 1.0.0 |

