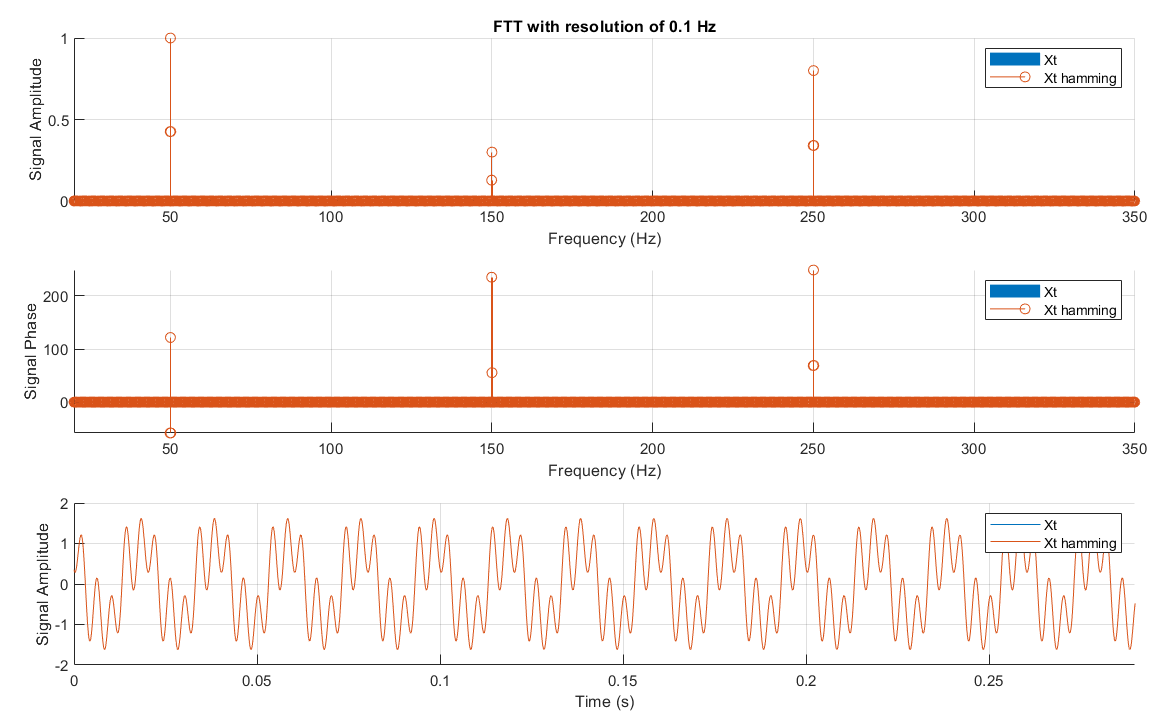
fft_plot function
Plot signal FFT norm and phase versus frequency and signal versus time. Customizable display, also return FFT data.

You are now following this Submission
- You will see updates in your followed content feed
- You may receive emails, depending on your communication preferences
Cite As
pierre-alexandre chauvenet (2026). fft_plot function (https://ch.mathworks.com/matlabcentral/fileexchange/72124-fft_plot-function), MATLAB Central File Exchange. Retrieved .
https://stackoverflow.com/questions/33962554/finding-the-phase-of-each-harmonics-using-fft
General Information
- Version 1.0.4 (3 KB)
MATLAB Release Compatibility
- Compatible with any release
Platform Compatibility
- Windows
- macOS
- Linux
| Version | Published | Release Notes | Action |
|---|---|---|---|
| 1.0.4 | add option to replace frequency axis with harmonic number |
||
| 1.0.3 | additional display options |
||
| 1.0.2 | - take both line or column signal input |
||
| 1.0.1 | return fft data (norm, angle, frequency)
|
||
| 1.0.0 |

