Main Content

seqqcplot

Create quality control plots for sequence and quality data in MATLAB

Description

example

seqqcplot(dataSource) generates a figure with 
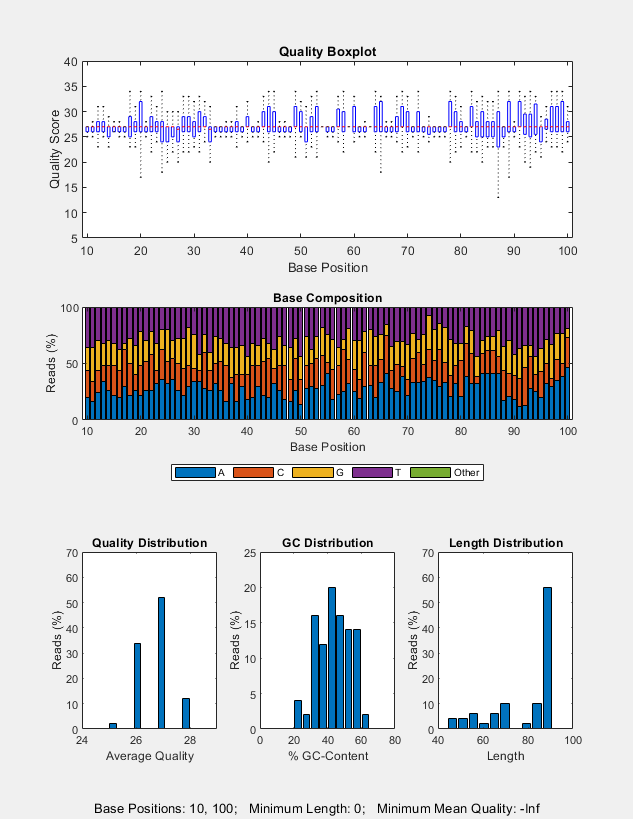
quality control (QC) plots of sequence and quality data from dataSource in MATLAB. The figure contains the following types of QC plots.

  • Box plot for the average quality score at each sequence position

  • Bar plot for the sequence base composition at each sequence position

  • Histogram of the average sequence quality score distribution

  • Histogram of the GC-content distribution

  • Histogram of the sequence length distribution

In the figure, you can click a specific plot to open it in a separate window.

example

seqqcplot(dataSource,type) generates a QC plot specified by type.

example

seqqcplot(dataSource,type,encoding) also specifies the encoding format of the base quality in the input file.

example

seqqcplot(___,Name,Value) uses any of the input arguments in the previous syntaxes and additional options specified by one or more Name,Value pair arguments.

example

H = seqqcplot(___) returns the figure handle H of the output figure.

Examples

collapse all

Plot quality control plots for sequence statistics and quality data from a FASTQ file.

seqqcplot('SRR005164_1_50.fastq');

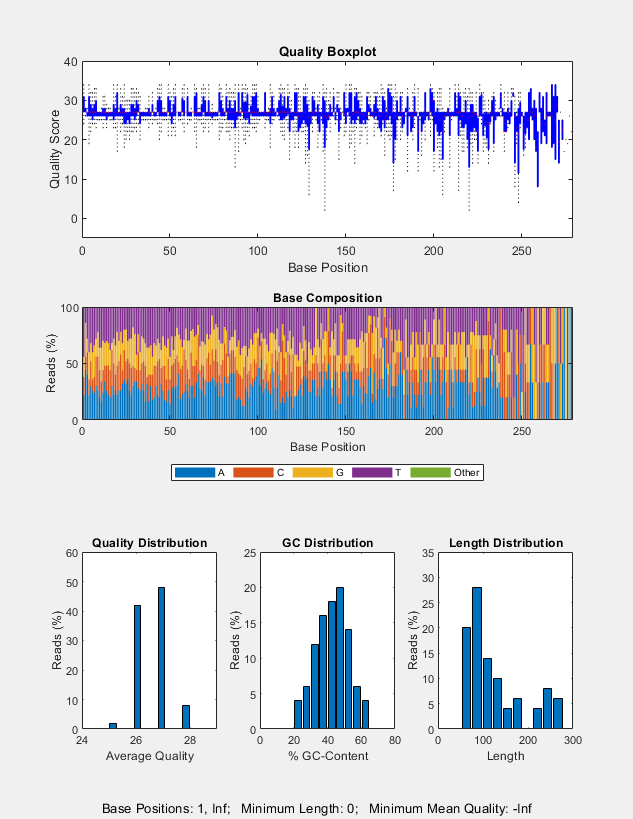
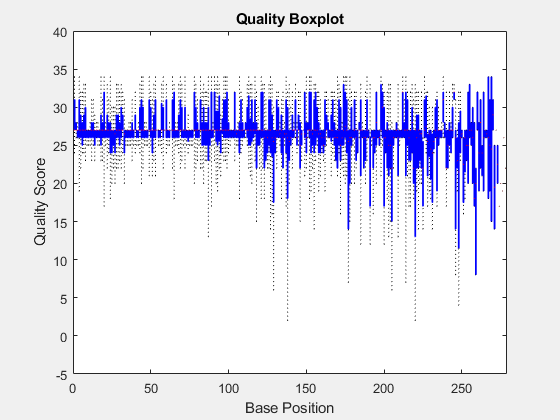
Plot only the box plot of average quality score for each sequence position.

seqqcplot('SRR005164_1_50.fastq','QualityBoxplot');

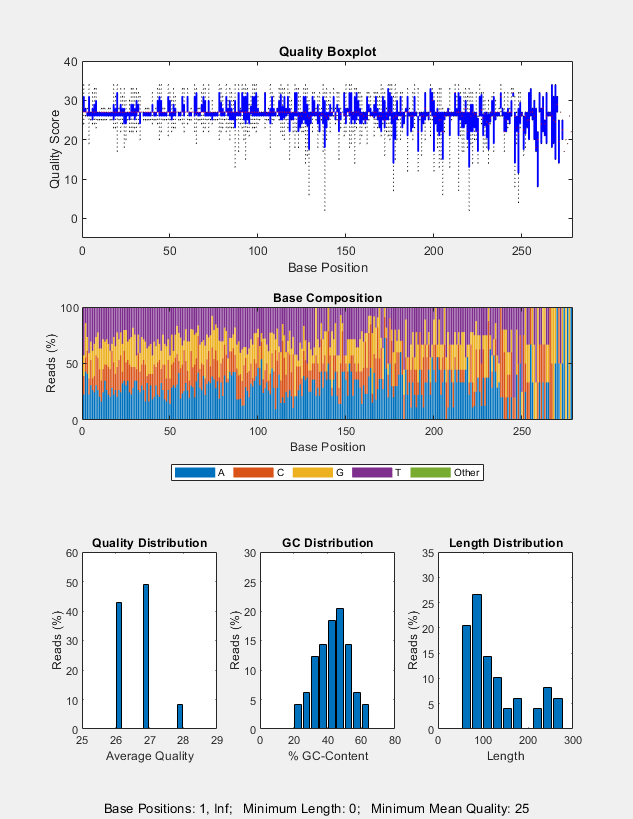
Plot the quality data of sequences with a minimum mean quality of 25.

seqqcplot('SRR005164_1_50.fastq','MeanQuality',25);

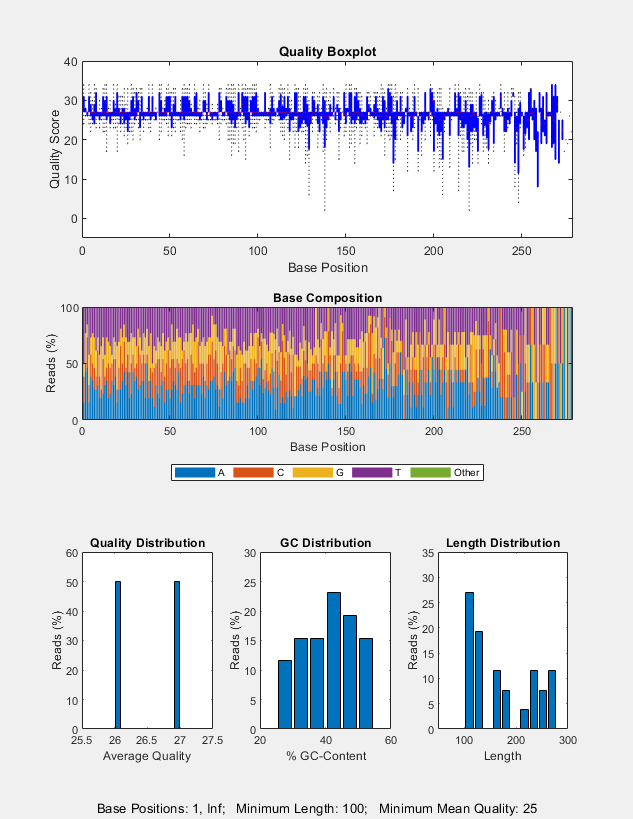
Plot the data of sequences having a minimum mean quality of 25 and a minimum sequence length of 100.

seqqcplot('SRR005164_1_50.fastq','MeanQuality',25,'MinLength',100);

Produce QC plots for the quality data corresponding to the subsequences from base position 10 to 100.

seqqcplot('SRR005164_1_50.fastq','BasePositions',[10 100]);

Input Arguments

collapse all

Sequence and quality information, specified as a BioMap object, BioRead object, character vector, string, string vector, or cell array of character vectors representing the names of FASTQ, SAM, or BAM files.

seqqcplot uses the read quality data, instead of the alignment quality, if you specify SAM or BAM files, a BioRead or BioMap object.

Example: 'SRR005164_1_50.fastq'

Name of the QC plot to generate, specified as one of the following:

Name of QC PlotDescription
'QualityBoxplot'Box plot for the average quality score at each sequence position.
'CompositionLine'Line plot for the sequence base composition at each sequence position.
'CompositionBar'Bar plot for the sequence base composition at each sequence position.
'QualityDistribution'Histogram of the average sequence quality score distribution.
'GCDistribution'Histogram of the GC-content distribution.
'LengthDistribution'Histogram of the sequence length distribution.
'Summary'Summary figure containing all available QC plots, except the 'CompositionLine' plot. The figure also shows the values of name-value pairs that were used to generate the plots. If name-value pairs were not specified, it shows the corresponding default values instead.

By default, all available QC plots are plotted as subplots in a figure. To open a specific subplot in a separate figure window, click the subplot.

Example: 'QualityBoxplot'

Encoding format of the base quality, specified as one of the following:

  • 'Sanger'

  • 'Solexa'

  • 'Illumina13'

  • 'Illumina15'

  • 'Illumina18'

  • 'Illumina19'

Example: 'Sanger'

Name-Value Arguments

Specify optional pairs of arguments as Name1=Value1,...,NameN=ValueN, where Name is the argument name and Value is the corresponding value. Name-value arguments must appear after other arguments, but the order of the pairs does not matter.

Before R2021a, use commas to separate each name and value, and enclose Name in quotes.

Example: 'MeanQuality',5

Minimum threshold on the average base quality across each sequence, specified as a numeric scalar. The function considers only sequences with average quality score equal to or greater than the threshold. The threshold value is interpreted according to the specified encoding format. Default is -Inf, that is, any sequence is considered.

Example: 'MeanQuality',5

Minimum threshold on the sequence length, specified as a nonnegative numeric scalar. The function considers only sequences with length equal to or greater than the threshold.

Example: 'MinLength',100

Base position range for subsequences, specified as a two-element vector. The function considers only the subsequences in the specified position range. Default is [1 Inf], that is, the entire length of each sequence is considered.

Example: 'BasePositions',[5 50]

Output Arguments

collapse all

Handle to the output figure, returned as a figure handle.

Version History

Introduced in R2017a