colorChecker
Calibrite ColorChecker test chart
Description
A colorChecker object stores the positions and measurements of
the regions of interest (ROIs) of a Calibrite ColorChecker® Classic test chart (formerly produced by X-Rite® and GretagMacbeth®) [1].
Creation
Syntax
Description
chart = colorChecker(A) creates a colorChecker
object from input image A. The input image sets the Image property.
chart = colorChecker(A, controls
the automatic chart detection using one or more name-value arguments.Name=Value)
chart = colorChecker(A,"RegistrationPoints",p) creates a
colorChecker object and sets the RegistrationPoints
property using the specified points in p.
Name-Value Arguments
Properties
Object Functions
measureColor | Measure color reproduction using test chart |
measureIlluminant | Measure scene illuminant using test chart |
displayChart | Display test chart with overlaid regions of interest |
Examples
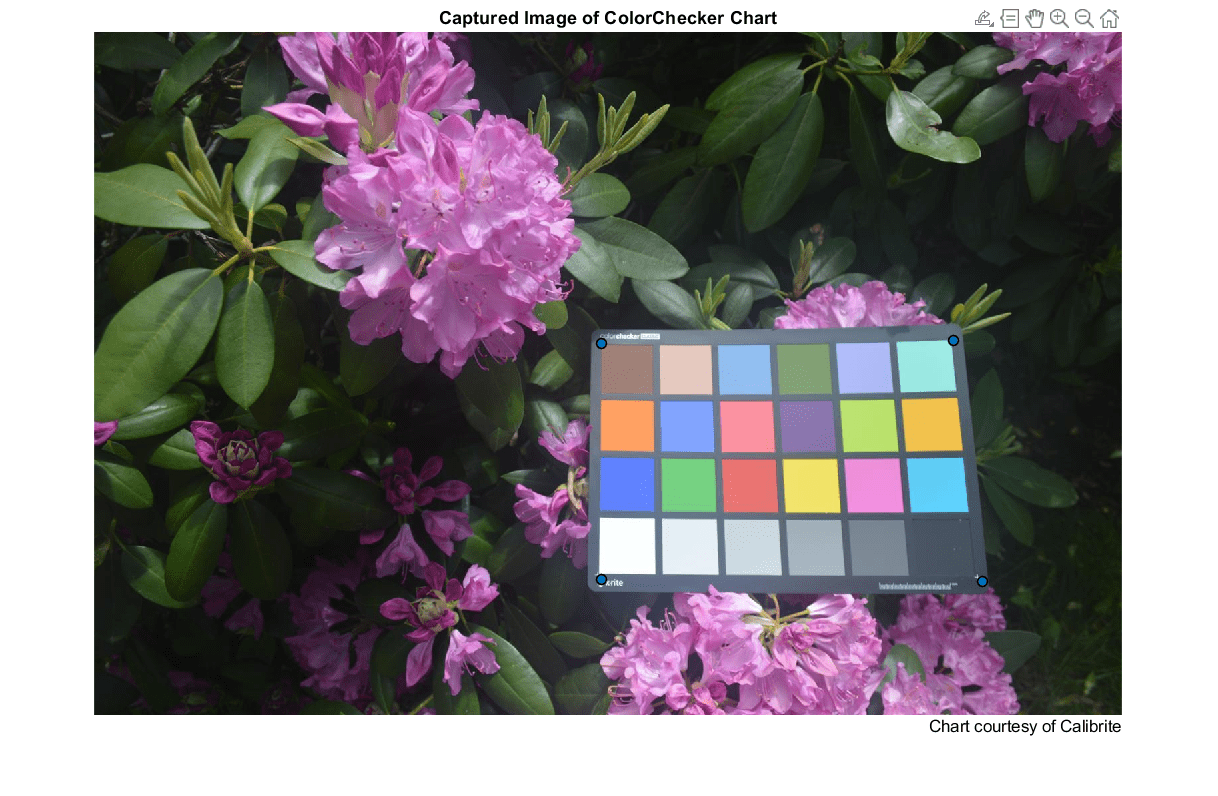
Read an image of a ColorChecker® chart into the workspace.
I = imread("colorCheckerTestImage.jpg");Display the image.
imshow(I)
title("Captured Image of ColorChecker Chart")
text(size(I,2),size(I,1)+15,"Chart courtesy of Calibrite", ...
    "FontSize",10,"HorizontalAlignment","right")

Create a colorChecker object by performing automatic chart detection on the image.
chart = colorChecker(I)
chart =
  colorChecker with properties:

                 Image: [1024×1541×3 uint8]
    RegistrationPoints: [4×2 double]
             ColorROIs: [24×1 struct]
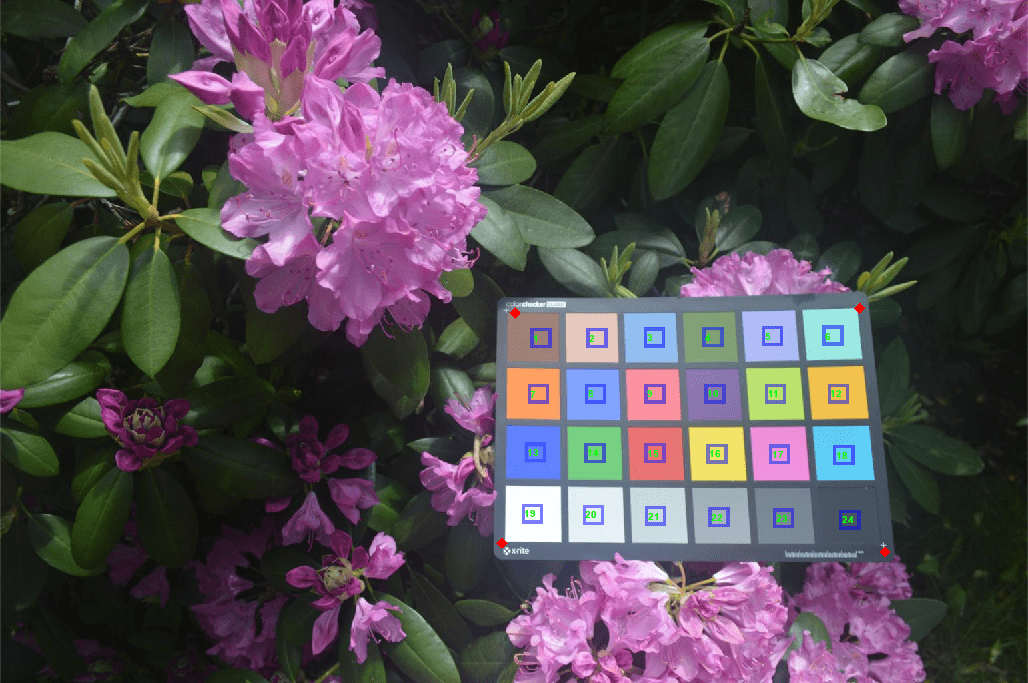
To confirm that the colorChecker object detected the chart correctly, display the chart and detected ROIs. Each ROI appears as a blue rectangle centered in the appropriate color patch. The registration points appear as red diamonds on the outer corners of the chart.
displayChart(chart)
Read an image of a ColorChecker® chart into the workspace.
I = imread("colorCheckerTestImage.jpg");Display the image.
imshow(I)
title("Captured Image of ColorChecker Chart")
text(size(I,2),size(I,1)+15,"Chart courtesy of Calibrite", ...
    "FontSize",10,"HorizontalAlignment","right")
Draw point ROIs that overlap the plus-shaped (+) fiducials at the corners of the chart.
blackPoint = drawpoint;
whitePoint = drawpoint;
darkSkinPoint = drawpoint;
bluishGreenPoint = drawpoint;
Combine the (x,y) coordinates of the point ROIs into a 4-by-2 matrix.
cornerPoints = [blackPoint.Position;
    whitePoint.Position;
    darkSkinPoint.Position;
    bluishGreenPoint.Position];
Create a colorChecker object by specifying the (x,y) coordinates of the corner registration points.
chart = colorChecker(I,"RegistrationPoints",cornerPoints);To confirm that the colorChecker object detected the chart correctly, display the chart and detected ROIs.
displayChart(chart)

Tips
Some measurement functions expect that test chart data is in the sRGB color space. If your image is not in the sRGB color space, you can convert it to the intermediate L*a*b* color space using
rgb2laband then to the sRGB color space usinglab2rgb.There are two manufactured versions of the ColorChecker test chart that have slightly different reference values. The reference values of the
colorCheckerobject match the "After November 2014" version of the chart.
References
[1] Calibrite. "ColorChecker Classic". https://calibrite.com/us/product/colorchecker-classic/.
[2] Fernandez, P. D. M., F. A. Guerrero-Peña, T. I. Ren, and G. J. J. Leandro, "Fast and robust multiple ColorChecker detection using deep convolutional neural networks," Image and Vision Computing, Volume 81, 2019, pp. 15-24.
Version History
Introduced in R2020b