contour3m
Project 3-D contour plot of map data
Syntax
Description
contour3m(___, specifies
the contour lines to display, in addition to any combination of arguments from the previous
syntaxes.levels)
contour3m(___,
specifies additional options for the contour plot using one or more name-value
arguments.Name,Value)
C = contour3m(___)C, which contains the latitude and longitude coordinates
of the vertices at each level.
Examples
Input Arguments
Name-Value Arguments
Output Arguments
Tips
When you use the
contour3mfunction with anaxesm-based map that contains aglobemap frame, thecontour3mfunction issues a warning.The
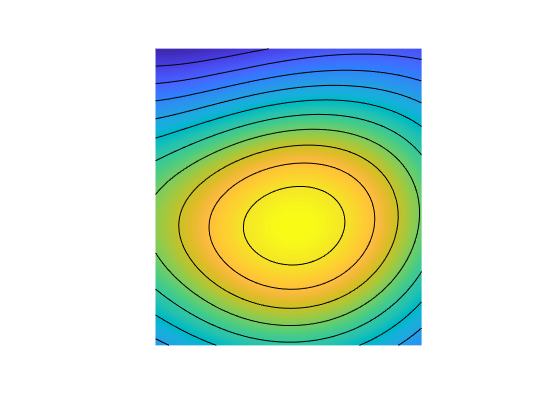
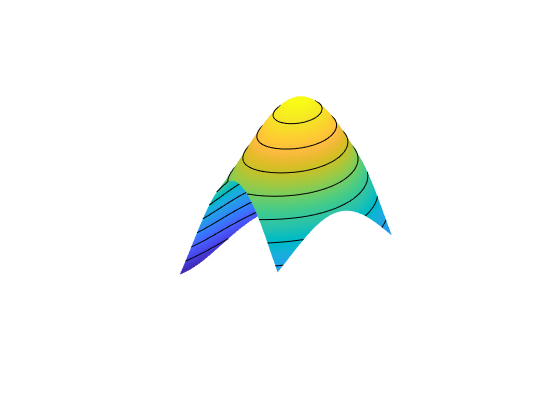
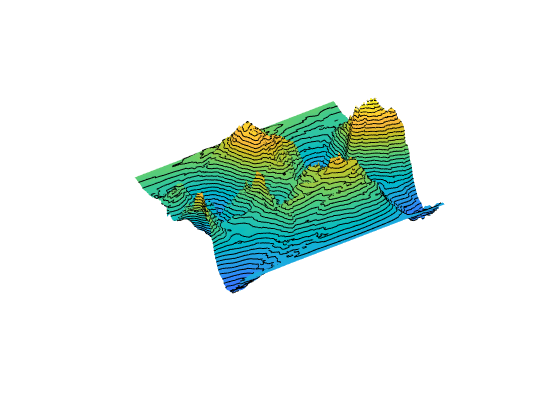
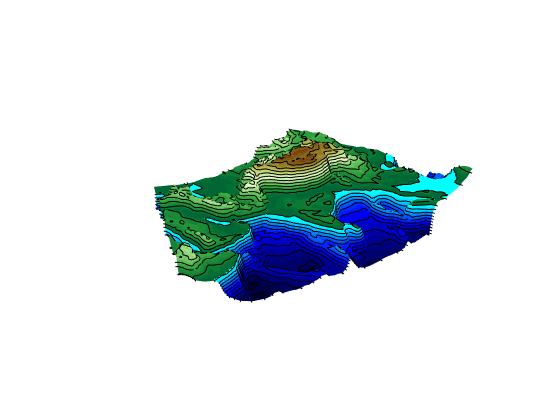
contour3mfunction behaves the same as thecontourmfunction, except thecontour3mfunction displays the lines for each contour level at the z-coordinate equal to the value of the level.


