Select Times in Timetable
A timetable is a type of table that associates a time with each row. You can select time-based subsets of its data in several ways:
Find times within a certain range using the
timerangeorwithtolfunctions.Match recurring units of time, such as days or months, using the components of
datetimearrays.Resample or group data with the
retimefunction.
For example, read a sample file outages.csv, containing data representing electric utility outages in the United States from 2002–2014. The vector of row times, OutageTime, indicates when the outages occurred. The readtimetable function imports it as a datetime array. To import text as string arrays, specify the TextType name-value argument as "string".
TT = readtimetable("outages.csv",TextType="string")
TT=1468×5 timetable
       OutageTime         Region        Loss     Customers     RestorationTime           Cause
    ________________    ___________    ______    __________    ________________    _________________

    2002-02-01 12:18    "SouthWest"    458.98    1.8202e+06    2002-02-07 16:50    "winter storm"
    2003-01-23 00:49    "SouthEast"    530.14    2.1204e+05                 NaT    "winter storm"
    2003-02-07 21:15    "SouthEast"     289.4    1.4294e+05    2003-02-17 08:14    "winter storm"
    2004-04-06 05:44    "West"         434.81    3.4037e+05    2004-04-06 06:10    "equipment fault"
    2002-03-16 06:18    "MidWest"      186.44    2.1275e+05    2002-03-18 23:23    "severe storm"
    2003-06-18 02:49    "West"              0             0    2003-06-18 10:54    "attack"
    2004-06-20 14:39    "West"         231.29           NaN    2004-06-20 19:16    "equipment fault"
    2002-06-06 19:28    "West"         311.86           NaN    2002-06-07 00:51    "equipment fault"
    2003-07-16 16:23    "NorthEast"    239.93         49434    2003-07-17 01:12    "fire"
    2004-09-27 11:09    "MidWest"      286.72         66104    2004-09-27 16:37    "equipment fault"
    2004-09-05 17:48    "SouthEast"    73.387         36073    2004-09-05 20:46    "equipment fault"
    2004-05-21 21:45    "West"         159.99           NaN    2004-05-22 04:23    "equipment fault"
    2002-09-01 18:22    "SouthEast"    95.917         36759    2002-09-01 19:12    "severe storm"
    2003-09-27 07:32    "SouthEast"       NaN    3.5517e+05    2003-10-04 07:02    "severe storm"
    2003-11-12 06:12    "West"         254.09    9.2429e+05    2003-11-17 02:04    "winter storm"
    2004-09-18 05:54    "NorthEast"         0             0                 NaT    "equipment fault"
      ⋮
Select Time Range
To find data in a specific range, you can use the timerange function, which defines time-based subscripts for indexing. For instance, define a range for the summer of 2008, which started on June 20 and ended on September 21. By default, timerange defines a half-open interval that is closed on the left and open on the right, so specify the end date as September 22.
TR = timerange("2008-06-20","2008-09-22")
TR =
	timetable timerange subscript:

		Select timetable rows with times in the half-open interval:
		  Starting at, including:   20-Jun-2008 00:00:00
		  Ending at, but excluding: 22-Sep-2008 00:00:00

	See Select Times in Timetable.
Find the outages that occurred in that range, and then plot the number of customers affected over time.
summer08 = TT(TR,:);
stem(summer08.OutageTime,summer08.Customers)
ylabel("Customers")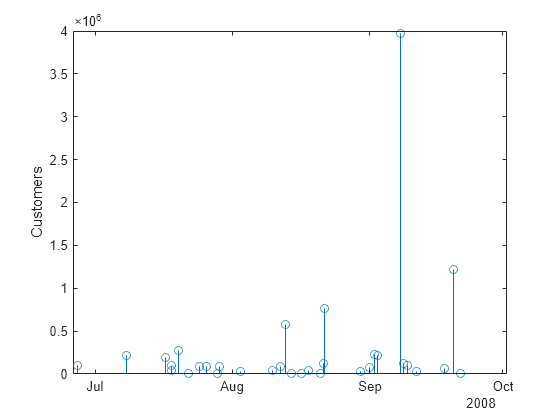
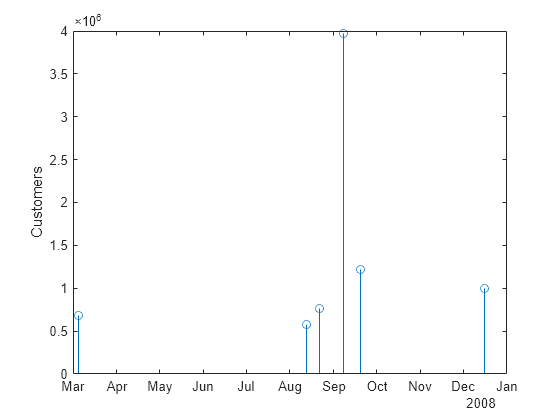
Several outages during that time range had high customer impact. Expand the range to a time period that spans the entire year of 2008 and look for similarly high numbers.
TR = timerange("2008","years");
all08 = TT(TR,:);
high08 = all08(all08.Customers > 500000,:);

stem(high08.OutageTime,high08.Customers)
ylabel("Customers")
The timerange function is also helpful for selecting specific dates. Selecting times by comparing datetime values can give misleading results because all datetime values include both date and time components. However, when you specify only the date component of a datetime value, the time component is set to midnight. Therefore, although there is data from June 26, a comparison like this one returns no results.
any(summer08.OutageTime == datetime("2008-06-26"))ans = logical
0
Instead, you can use timerange.
TR = timerange("2008-06-26","days");
june26 = summer08(TR,:)
june26=1×5 timetable
       OutageTime         Region        Loss     Customers    RestorationTime          Cause
    ________________    ___________    ______    _________    ________________    _______________

    2008-06-26 22:36    "NorthEast"    425.21      93612      2008-06-27 06:53    "thunder storm"
Another way to define a range is to specify a tolerance around a time using withtol. For example, find rows from the summer of 2008 where OutageTime is within three days of Labor Day, September 1.
WT = withtol("2008-09-01",days(3));
nearSep1 = summer08(WT,:)nearSep1=4×5 timetable
OutageTime Region Loss Customers RestorationTime Cause
________________ ___________ ______ _________ ________________ _________________
2008-09-01 23:35 "SouthEast" 206.27 2.27e+05 NaT "equipment fault"
2008-09-01 00:18 "MidWest" 510.05 74213 2008-09-01 14:07 "thunder storm"
2008-09-02 19:01 "MidWest" NaN 2.215e+05 2008-09-03 02:58 "severe storm"
2008-08-29 20:25 "West" NaN 31624 2008-09-01 01:51 "wind"
Match Units of Time
You also can use units of datetime values, such as hours or days, to identify rows for logical indexing. This method can be useful for specifying periodic intervals.
For example, find the values of OutageTime whose month components have values of 3 or less, corresponding to January, February, and March of each year. Use the resulting logical array to index into TT.
TR = (month(TT.OutageTime) <= 3);
winterTT = TT(TR,:)
winterTT=316×5 timetable
       OutageTime         Region        Loss     Customers     RestorationTime           Cause
    ________________    ___________    ______    __________    ________________    __________________

    2002-02-01 12:18    "SouthWest"    458.98    1.8202e+06    2002-02-07 16:50    "winter storm"
    2003-01-23 00:49    "SouthEast"    530.14    2.1204e+05                 NaT    "winter storm"
    2003-02-07 21:15    "SouthEast"     289.4    1.4294e+05    2003-02-17 08:14    "winter storm"
    2002-03-16 06:18    "MidWest"      186.44    2.1275e+05    2002-03-18 23:23    "severe storm"
    2005-02-04 08:18    "MidWest"         NaN           NaN    2005-02-04 19:51    "attack"
    2005-03-08 16:37    "SouthEast"    1339.2    4.3003e+05    2005-03-10 20:42    "winter storm"
    2002-03-26 01:59    "MidWest"      388.04    5.6422e+05    2002-03-28 19:55    "winter storm"
    2003-03-27 08:03    "NorthEast"    204.79     1.479e+05    2003-03-28 05:54    "severe storm"
    2003-02-24 06:13    "SouthEast"         0             0    2003-02-24 21:18    "attack"
    2002-03-05 17:53    "MidWest"      96.563    2.8666e+05    2002-03-10 14:41    "wind"
    2006-01-21 21:27    "SouthEast"    19.513         10994    2006-01-21 23:25    "equipment fault"
    2004-01-19 12:37    "MidWest"       16.03        2.2296    2004-01-20 02:50    "equipment fault"
    2005-03-01 14:39    "West"         115.47         82611    2005-03-03 05:58    "equipment fault"
    2003-01-10 15:38    "West"         185.85     2.757e+05    2003-01-12 05:48    "winter storm"
    2004-01-14 20:01    "NorthEast"     87.08         14979    2004-01-16 00:52    "energy emergency"
    2004-01-04 10:45    "NorthEast"    145.86         27942    2004-01-08 19:34    "energy emergency"
      ⋮
Create a pie chart of the wintertime causes. The pie function accepts only numeric or categorical inputs, so first convert Cause to categorical.
winterTT.Cause = categorical(winterTT.Cause);
pie(winterTT.Cause)
title("Causes of Outages, January to March");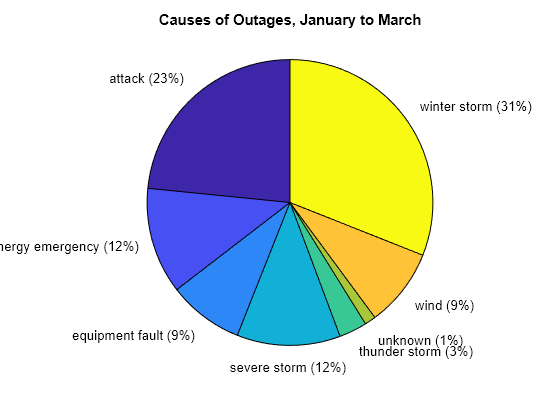
Group by Time Period
The retime function adjusts row times to create specified intervals, either by resampling or grouping values. Its pre-defined intervals range from seconds to years, and you can specify how to handle missing or multiple values for the intervals. For instance, you can select the first observation from each week, or count observations in a quarter.
For the outage data, you can use retime to find totals for each year. First, create a timetable with only numeric variables. Then, call retime and specify a yearly interval, combining multiple values using a sum. The output has one row for each year, containing the total losses and total customers affected during that year.
numTT = TT(:,vartype("numeric"));
numTT = retime(numTT,"yearly","sum")
numTT=13×2 timetable
       OutageTime       Loss     Customers
    ________________    _____    __________

    2002-01-01 00:00    81335    1.3052e+07
    2003-01-01 00:00    58036     1.396e+07
    2004-01-01 00:00    51014    1.5523e+07
    2005-01-01 00:00    33980    8.7334e+06
    2006-01-01 00:00    35129    2.5729e+07
    2007-01-01 00:00    29112    1.2494e+07
    2008-01-01 00:00    34608    1.7608e+07
    2009-01-01 00:00    15487    1.1785e+07
    2010-01-01 00:00    51543    2.7614e+07
    2011-01-01 00:00    34834    1.3614e+07
    2012-01-01 00:00    42548    1.8905e+07
    2013-01-01 00:00    19572    1.1284e+07
    2014-01-01 00:00        0             0
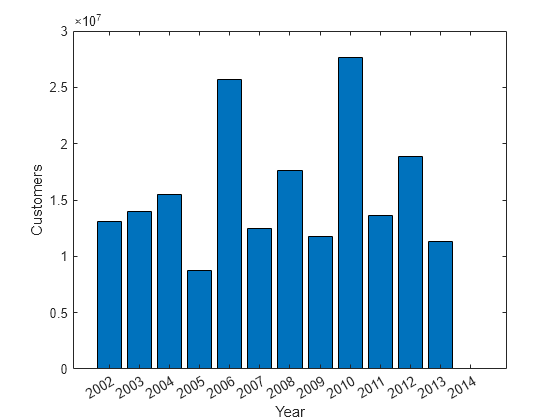
Create a bar chart of the number of customers affected each year.
bar(numTT.OutageTime,numTT.Customers)
xlabel("Year")
ylabel("Customers")
Calculate Durations Using Row Times
You can use the row times of a timetable with other datetime or duration values to perform calculations. For example, calculate the durations of the power outages listed in the outage data. Then calculate the monthly medians of the outage durations and plot them.
First add the outage durations to TT by subtracting the row times (which are the starts of power outages) from RestorationTime (which are the ends of the power outages). Change the format of OutageDuration to display the durations of the outages in days.
TT.OutageDuration = TT.RestorationTime - TT.OutageTime;
TT.OutageDuration.Format = "d"TT=1468×6 timetable
OutageTime Region Loss Customers RestorationTime Cause OutageDuration
________________ ___________ ______ __________ ________________ _________________ ______________
2002-02-01 12:18 "SouthWest" 458.98 1.8202e+06 2002-02-07 16:50 "winter storm" 6.1889 days
2003-01-23 00:49 "SouthEast" 530.14 2.1204e+05 NaT "winter storm" NaN days
2003-02-07 21:15 "SouthEast" 289.4 1.4294e+05 2003-02-17 08:14 "winter storm" 9.4576 days
2004-04-06 05:44 "West" 434.81 3.4037e+05 2004-04-06 06:10 "equipment fault" 0.018056 days
2002-03-16 06:18 "MidWest" 186.44 2.1275e+05 2002-03-18 23:23 "severe storm" 2.7118 days
2003-06-18 02:49 "West" 0 0 2003-06-18 10:54 "attack" 0.33681 days
2004-06-20 14:39 "West" 231.29 NaN 2004-06-20 19:16 "equipment fault" 0.19236 days
2002-06-06 19:28 "West" 311.86 NaN 2002-06-07 00:51 "equipment fault" 0.22431 days
2003-07-16 16:23 "NorthEast" 239.93 49434 2003-07-17 01:12 "fire" 0.36736 days
2004-09-27 11:09 "MidWest" 286.72 66104 2004-09-27 16:37 "equipment fault" 0.22778 days
2004-09-05 17:48 "SouthEast" 73.387 36073 2004-09-05 20:46 "equipment fault" 0.12361 days
2004-05-21 21:45 "West" 159.99 NaN 2004-05-22 04:23 "equipment fault" 0.27639 days
2002-09-01 18:22 "SouthEast" 95.917 36759 2002-09-01 19:12 "severe storm" 0.034722 days
2003-09-27 07:32 "SouthEast" NaN 3.5517e+05 2003-10-04 07:02 "severe storm" 6.9792 days
2003-11-12 06:12 "West" 254.09 9.2429e+05 2003-11-17 02:04 "winter storm" 4.8278 days
2004-09-18 05:54 "NorthEast" 0 0 NaT "equipment fault" NaN days
⋮
Create a timetable that has only the outage durations. Some rows of TT have missing values, NaT, for the restoration times, leading to NaN values in OutageDuration. To remove the NaN values from medianTT, use the rmmissing function. Then use retime to calculate the monthly median outage duration.
medianTT = TT(:,"OutageDuration");
medianTT = rmmissing(medianTT);
medianTT = retime(medianTT,"monthly",@median)
medianTT=143×1 timetable
       OutageTime       OutageDuration
    ________________    ______________

    2002-02-01 00:00      6.1889 days
    2002-03-01 00:00      2.7472 days
    2002-04-01 00:00         NaN days
    2002-05-01 00:00     0.72917 days
    2002-06-01 00:00     0.22431 days
    2002-07-01 00:00     0.64653 days
    2002-08-01 00:00     0.49514 days
    2002-09-01 00:00     0.10139 days
    2002-10-01 00:00      2.3451 days
    2002-11-01 00:00     0.12222 days
    2002-12-01 00:00      2.0243 days
    2003-01-01 00:00      1.5903 days
    2003-02-01 00:00      3.2955 days
    2003-03-01 00:00     0.47326 days
    2003-04-01 00:00     0.95347 days
    2003-05-01 00:00      2.2882 days
      ⋮
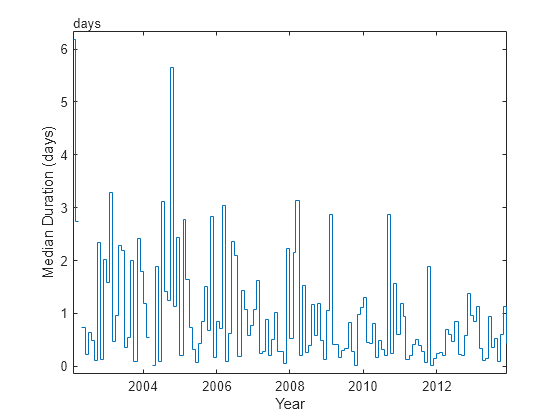
Create a stairstep chart of the monthly median outage durations.
stairs(medianTT.OutageTime,medianTT.OutageDuration)
xlabel("Year")
ylabel("Median Duration (days)")
See Also
categorical | timetable | retime | timerange | readtimetable | month | withtol | rmmissing | vartype | datetime | duration | NaT