selectFeatures
Description
F = selectFeatures(R,featureNames)featureNames for the radiomics object
R.
Examples
Load an X-ray image into the workspace as a medicalImage object. Visualize the image.
data = medicalImage("forearmXrayImage1.dcm");
I = data.Pixels;
figure
imshow(I,[])
Draw two regions of interest (ROI) in the X-ray image. Create masks from the ROIs.
roi1 = drawassisted(Color="g");
roi2 = drawassisted(Color="r");
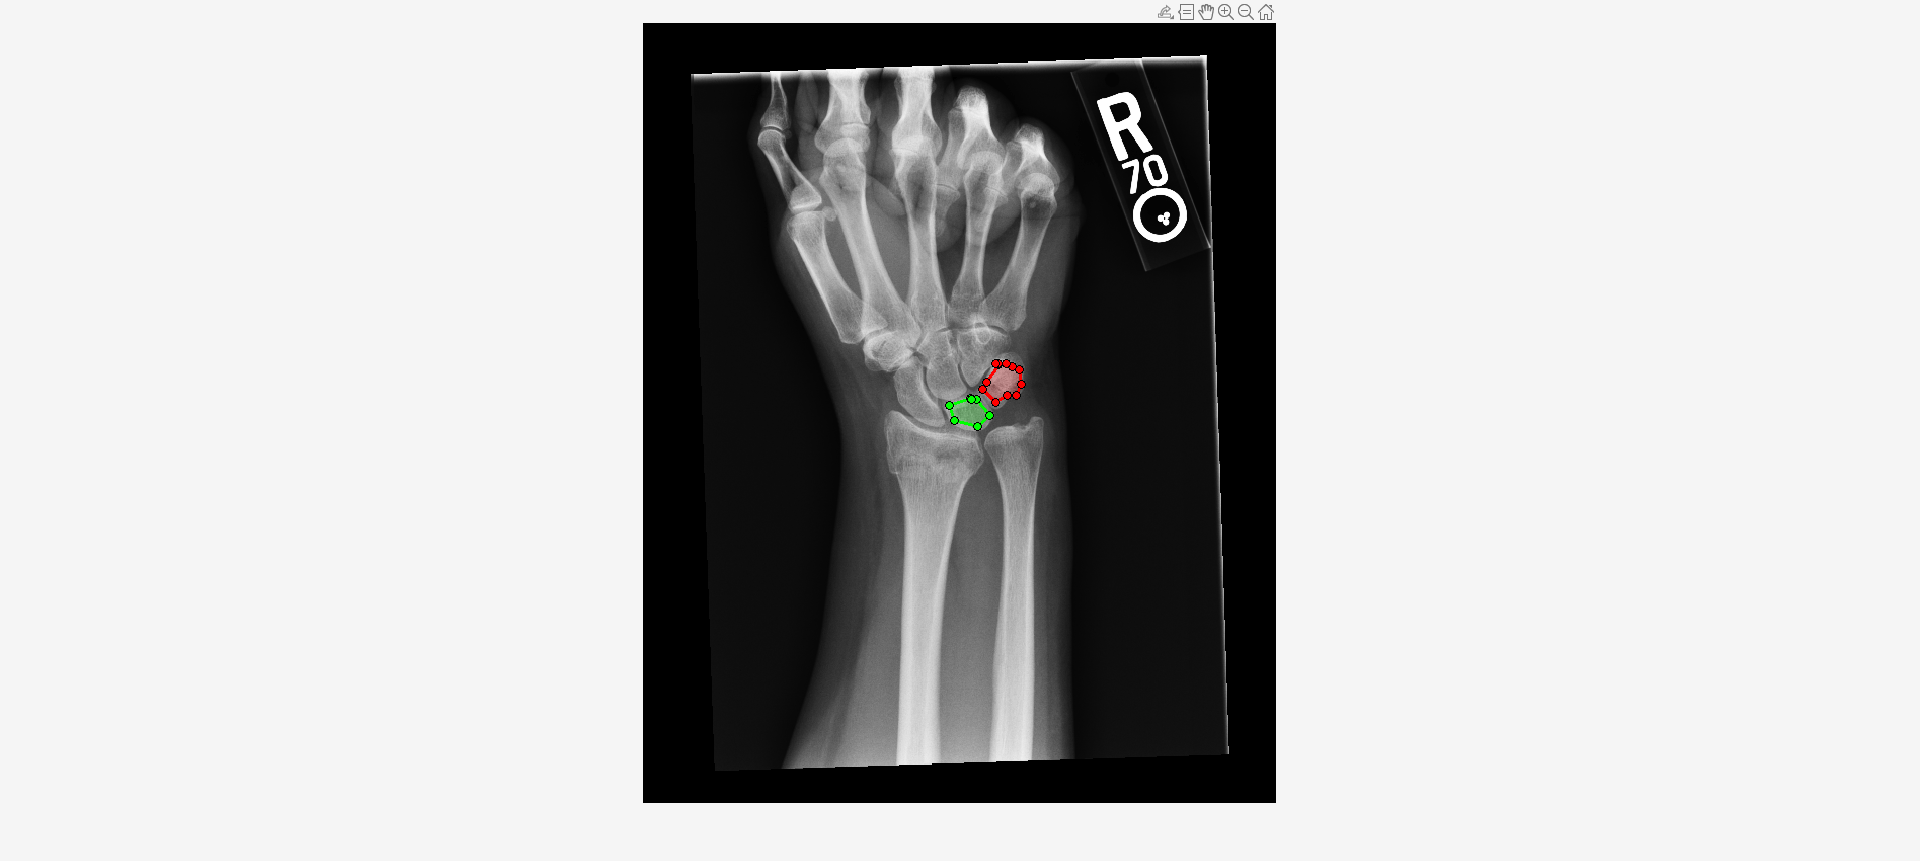
mask1 = createMask(roi1,I);
mask2 = createMask(roi2,I);
Create an ROI label matrix, using different labels for the two ROIs. Create a medicalImage object of the ROI label data.
mask = zeros(size(I));
mask(mask1) = 1;
mask(mask2) = 2;
info = dicominfo("forearmXrayImage1.dcm");
roi = medicalImage(mask,info);
Create a radiomics object from the X-ray image data and ROI label data.
R = radiomics(data,roi)
R =
  radiomics with properties:

                             Data: [1×1 medicalImage]
                         ROILabel: [1×1 medicalImage]
                         Resample: 0
                        Resegment: 1
                       Discretize: 1
                    DiscretizeIVH: 1
            ResampledVoxelSpacing: []
               DataResampleMethod: []
               MaskResampleMethod: []
              ResegmentationRange: []
                  ExcludeOutliers: 1
       DiscreteBinSizeOrBinNumber: []
                   DiscreteMethod: 'FixedBinNumber'
    DiscreteIVHBinSizeOrBinNumber: []
                DiscreteIVHMethod: 'FixedBinNumber'
Compute selected features for both ROIs.
F = selectFeatures(R,["MeanIntensity2D","ContrastAveraged2D"])
F=2×3 table
    "1"    2.3144e+03    122.8478
    "2"    2.4385e+03    104.5714
Import a computed tomography (CT) image volume and the corresponding ROI mask volume from the IBSI validation data set [1][2][3] as medicalVolume objects.
unzip("CTImageMaskNIfTI.zip")
data = medicalVolume("CT_image.nii.gz");
roi = medicalVolume("CT_mask.nii.gz");
Visualize a slice of the CT image volume and the corresponding ROI.
figure
imshowpair(data.Voxels(:,:,20),roi.Voxels(:,:,20),"montage")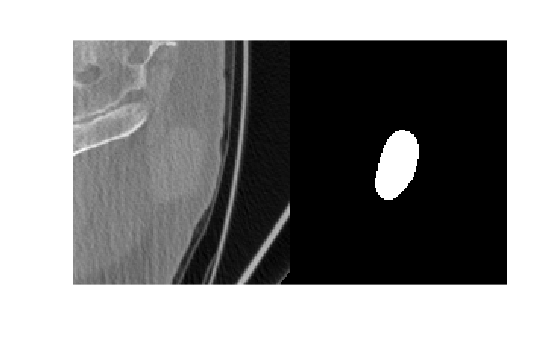
Create a radiomics object, using the CT image volume and ROI mask volume, with default preprocessing options.
R = radiomics(data,roi)
R =
  radiomics with properties:

                             Data: [1×1 medicalVolume]
                         ROILabel: [1×1 medicalVolume]
                         Resample: 1
                        Resegment: 1
                       Discretize: 1
                    DiscretizeIVH: 1
            ResampledVoxelSpacing: 1
               DataResampleMethod: 'linear'
               MaskResampleMethod: 'linear'
              ResegmentationRange: []
                  ExcludeOutliers: 1
       DiscreteBinSizeOrBinNumber: []
                   DiscreteMethod: 'FixedBinNumber'
    DiscreteIVHBinSizeOrBinNumber: []
                DiscreteIVHMethod: 'FixedBinNumber'
Compute the selected features of the ROI in the CT image volume.
I = selectFeatures(R,["Sphericity3D","IntensityHistogramMode3D","Busyness25D"])
I=1×4 table
    LabelID    Sphericity3D    IntensityHistogramMode3D    Busyness25D
    _______    ____________    ________________________    ___________

      "1"        0.80911                  10                 10.072
[1] Vallières, Martin, Carolyn R. Freeman, Sonia R. Skamene, and Issam El Naqa. “A Radiomics Model from Joint FDG-PET and MRI Texture Features for the Prediction of Lung Metastases in Soft-Tissue Sarcomas of the Extremities.” The Cancer Imaging Archive, 2015. https://doi.org/10.7937/K9/TCIA.2015.7GO2GSKS.
[2] Vallières, M, C R Freeman, S R Skamene, and I El Naqa. “A Radiomics Model from Joint FDG-PET and MRI Texture Features for the Prediction of Lung Metastases in Soft-Tissue Sarcomas of the Extremities.” Physics in Medicine and Biology 60, no. 14 (July 7, 2015): 5471–96. https://doi.org/10.1088/0031-9155/60/14/5471.
[3] Clark, Kenneth, Bruce Vendt, Kirk Smith, John Freymann, Justin Kirby, Paul Koppel, Stephen Moore, et al. “The Cancer Imaging Archive (TCIA): Maintaining and Operating a Public Information Repository.” Journal of Digital Imaging 26, no. 6 (December 2013): 1045–57. https://doi.org/10.1007/s10278-013-9622-7.
Input Arguments
Output Arguments
Version History
Introduced in R2025a