textureFeatures
Description
Examples
Load an X-ray image into the workspace as a medicalImage object. Visualize the image.
data = medicalImage("forearmXrayImage1.dcm");
I = data.Pixels;
figure
imshow(I,[])
Draw two regions of interest (ROI) in the X-ray image. Create masks from the ROIs.
roi1 = drawassisted(Color="g");
roi2 = drawassisted(Color="r");
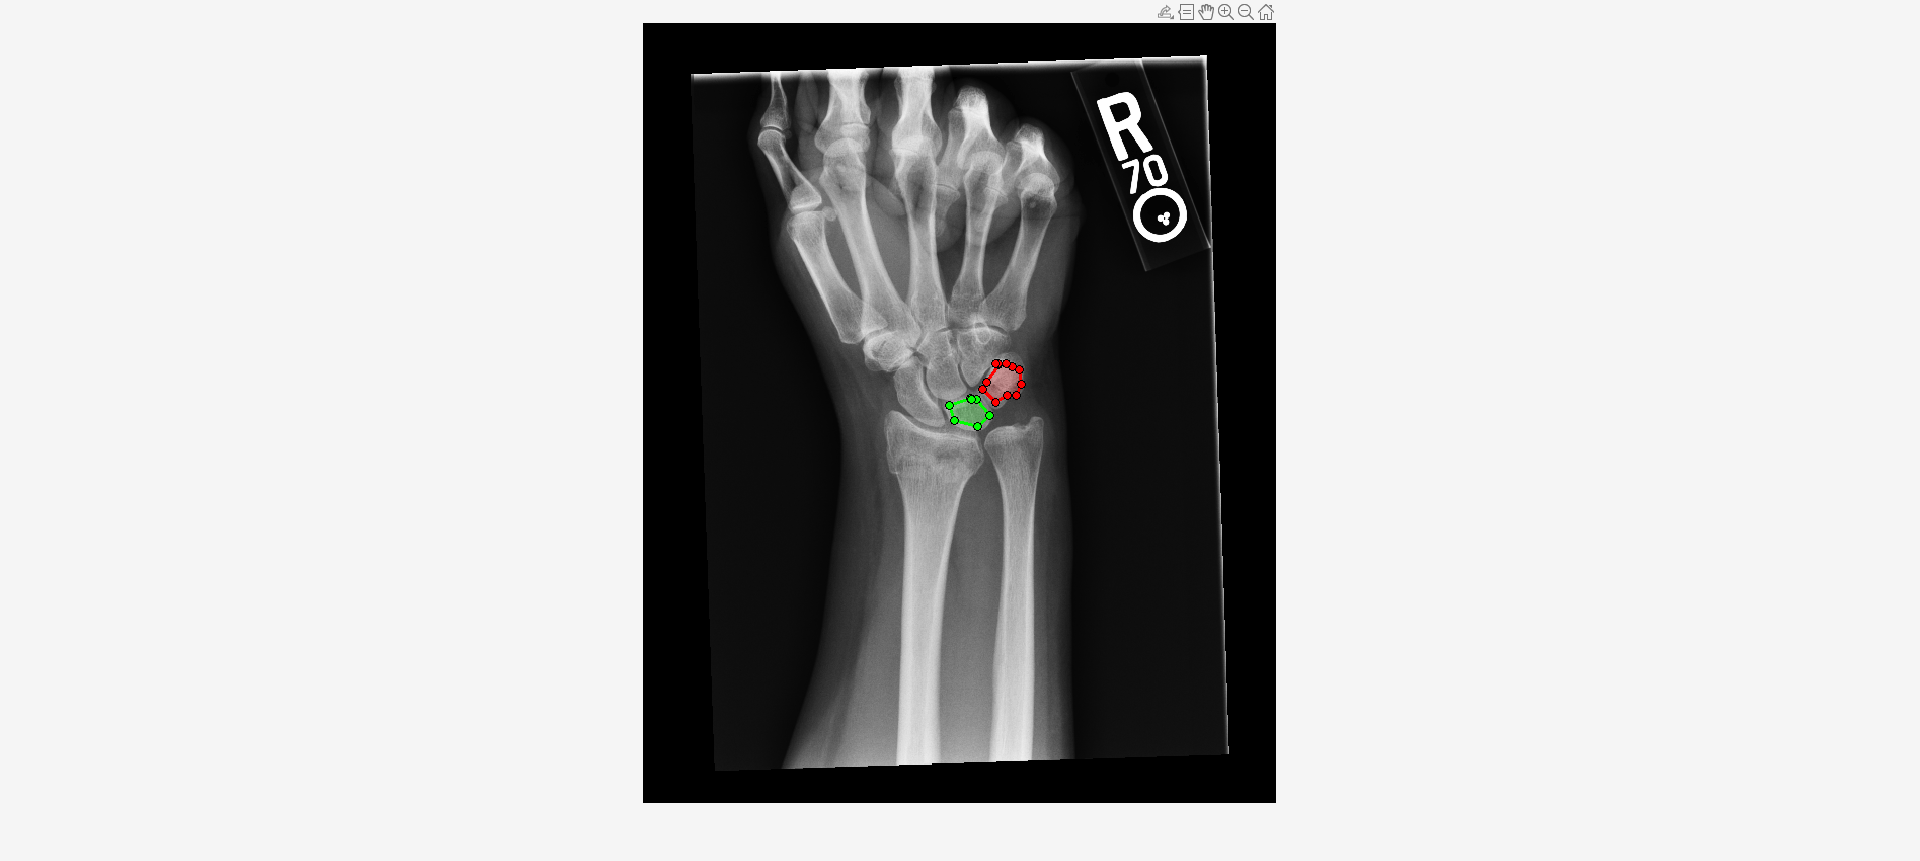
mask1 = createMask(roi1,I);
mask2 = createMask(roi2,I);
Create an ROI label matrix, using different labels for the two ROIs. Create a medicalImage object of the ROI label data.
mask = zeros(size(I));
mask(mask1) = 1;
mask(mask2) = 2;
info = dicominfo("forearmXrayImage1.dcm");
roi = medicalImage(mask,info);
Create a radiomics object from the X-ray image data and ROI label data.
R = radiomics(data,roi)
R =
  radiomics with properties:

                             Data: [1×1 medicalImage]
                         ROILabel: [1×1 medicalImage]
                         Resample: 0
                        Resegment: 1
                       Discretize: 1
                    DiscretizeIVH: 1
            ResampledVoxelSpacing: []
               DataResampleMethod: []
               MaskResampleMethod: []
              ResegmentationRange: []
                  ExcludeOutliers: 1
       DiscreteBinSizeOrBinNumber: []
                   DiscreteMethod: 'FixedBinNumber'
    DiscreteIVHBinSizeOrBinNumber: []
                DiscreteIVHMethod: 'FixedBinNumber'
Compute texture features for both ROIs.
T = textureFeatures(R)
T=2×137 table
    "1"    0.0025    57.1732      675.8153    11.0685    8.6729    46.5654    4.5233    114.3463    2.5804e+03    7.4309    5.9926e-04    122.8478    8.6729    0.1971    0.9492    0.1125    0.9951    0.1163    0.9090    3.8832e+03    2.5804e+03     1.3078e+05    23618430    -0.2975    0.9893    0.0016    57.1739      675.8519    11.5961
    "2"    0.0021    95.4544    1.0353e+03    11.4294    7.9161    41.0320    4.4079    190.9088    4.0368e+03    7.7995    4.6008e-04    104.5714    7.9161    0.2109    0.9534    0.1239    0.9958    0.1264    0.9495    1.0095e+04    4.0368e+03    -1.9066e+05    48382976    -0.3299    0.9944    0.0016    95.4542    1.0354e+03    11.8986
Import a computed tomography (CT) image volume and the corresponding ROI mask volume from the IBSI validation data set [1][2][3] as medicalVolume objects.
unzip("CTImageMaskNIfTI.zip")
data = medicalVolume("CT_image.nii.gz");
roi = medicalVolume("CT_mask.nii.gz");
Visualize a slice of the CT image volume and the corresponding ROI.
figure
imshowpair(data.Voxels(:,:,20),roi.Voxels(:,:,20),"montage")
Create a radiomics object, using the CT image volume and ROI mask volume, with default preprocessing options.
R = radiomics(data,roi)
R =
  radiomics with properties:

                             Data: [1×1 medicalVolume]
                         ROILabel: [1×1 medicalVolume]
                         Resample: 1
                        Resegment: 1
                       Discretize: 1
                    DiscretizeIVH: 1
            ResampledVoxelSpacing: 1
               DataResampleMethod: 'linear'
               MaskResampleMethod: 'linear'
              ResegmentationRange: []
                  ExcludeOutliers: 1
       DiscreteBinSizeOrBinNumber: []
                   DiscreteMethod: 'FixedBinNumber'
    DiscreteIVHBinSizeOrBinNumber: []
                DiscreteIVHMethod: 'FixedBinNumber'
Compute the grey level co-occurrence matrix (GLCM) texture features of the ROI in the 2-D resampled CT image volume.
I = textureFeatures(R,Type=["GLCM","GLRLM"],SubType="2D")
I=1×83 table
    LabelID    JointMaximumAveraged2D    JointAverageAveraged2D    JointVarianceAveraged2D    JointEntropyAveraged2D    DifferenceAverageAveraged2D    DifferenceVarianceAveraged2D    DifferenceEntropyAveraged2D    SumAverageAveraged2D    SumVarianceAveraged2D    SumEntropyAveraged2D    AngularSecondMomentAveraged2D    ContrastAveraged2D    DissimilarityAveraged2D    InverseDifferenceAveraged2D    NormalisedInverseDifferenceAveraged2D    InverseDifferenceMomentAveraged2D    NormalisedInverseDifferenceMomentAveraged2D    InverseVarianceAveraged2D    CorrelationAveraged2D    AutoCorrelationAveraged2D    ClusterTendencyAveraged2D    ClusterShadeAveraged2D    ClusterProminenceAveraged2D    InformationCorrelation1Averaged2D    InformationCorrelation2Averaged2D    JointMaximumSliceMerged2D    JointAverageSliceMerged2D    JointVarianceSliceMerged2D    JointEntropySliceMerged2D    DifferenceAverageSliceMerged2D    DifferenceVarianceSliceMerged2D    DifferenceEntropySliceMerged2D    SumAverageSliceMerged2D    SumVarianceSliceMerged2D    SumEntropySliceMerged2D    AngularSecondMomentSliceMerged2D    ContrastSliceMerged2D    DissimilaritySliceMerged2D    InverseDifferenceSliceMerged2D    NormalisedInverseDifferenceSliceMerged2D    InverseDifferenceMomentSliceMerged2D    NormalisedInverseDifferenceMomentSliceMerged2D    InverseVarianceSliceMerged2D    CorrelationSliceMerged2D    AutoCorrelationSliceMerged2D    ClusterTendencySliceMerged2D    ClusterShadeSliceMerged2D    ClusterProminenceSliceMerged2D    InformationCorrelation1SliceMerged2D    InformationCorrelation2SliceMerged2D    ShortRunsEmphasisAveraged2D    LongRunsEmphasisAveraged2D    LowGrayLevelRunEmphasisAveraged2D    HighGrayLevelRunEmphasisAveraged2D    ShortRunLowGrayLevelEmphasisAveraged2D    ShortRunHighGrayLevelEmphasisAveraged2D    LongRunLowGrayLevelEmphasisAveraged2D    LongRunHighGrayLevelEmphasisAveraged2D    GrayLevelNonUniformityAveraged2D    NormalisedGrayLevelNonUniformityAveraged2D    RunLengthNonUniformityAveraged2D    NormalisedRunLengthNonUniformityAveraged2D    RunPercentageAveraged2D    GrayLevelVarianceAveraged2D    RunLengthVarianceAveraged2D    RunEntropyAveraged2D    ShortRunsEmphasisSliceMerged2D    LongRunsEmphasisSliceMerged2D    LowGrayLevelRunEmphasisSliceMerged2D    HighGrayLevelRunEmphasisSliceMerged2D    ShortRunLowGrayLevelEmphasisSliceMerged2D    ShortRunHighGrayLevelEmphasisSliceMerged2D    LongRunLowGrayLevelEmphasisSliceMerged2D    LongRunHighGrayLevelEmphasisSliceMerged2D    GrayLevelNonUniformitySliceMerged2D    NormalisedGrayLevelNonUniformitySliceMerged2D    RunLengthNonUniformitySliceMerged2D    NormalisedRunLengthNonUniformitySliceMerged2D    RunPercentageSliceMerged2D    GrayLevelVarianceSliceMerged2D    RunLengthVarianceSliceMerged2D    RunEntropySliceMerged2D
    _______    ______________________    ______________________    _______________________    ______________________    ___________________________    ____________________________    ___________________________    ____________________    _____________________    ____________________    _____________________________    __________________    _______________________    ___________________________    _____________________________________    _________________________________    ___________________________________________    _________________________    _____________________    _________________________    _________________________    ______________________    ___________________________    _________________________________    _________________________________    _________________________    _________________________    __________________________    _________________________    ______________________________    _______________________________    ______________________________    _______________________    ________________________    _______________________    ________________________________    _____________________    __________________________    ______________________________    ________________________________________    ____________________________________    ______________________________________________    ____________________________    ________________________    ____________________________    ____________________________    _________________________    ______________________________    ____________________________________    ____________________________________    ___________________________    __________________________    _________________________________    __________________________________    ______________________________________    _______________________________________    _____________________________________    ______________________________________    ________________________________    __________________________________________    ________________________________    __________________________________________    _______________________    ___________________________    ___________________________    ____________________    ______________________________    _____________________________    ____________________________________    _____________________________________    _________________________________________    __________________________________________    ________________________________________    _________________________________________    ___________________________________    _____________________________________________    ___________________________________    _____________________________________________    __________________________    ______________________________    ______________________________    _______________________

      "1"             0.025292                   10.263                    9.9482                     6.9415                      2.6834                          4.353                          2.8719                      20.525                   27.92                   4.3458                     0.011452                     11.872                  2.6834                       0.39071                             0.8891                                 0.3042                                    0.97287                               0.30871                    0.39971                    111.04                        27.92                     -17.682                      2401.8                           -0.10434                              0.66674                         0.021298                      10.262                        9.9491                       7.1238                          2.678                             4.5887                             2.9277                        20.525                      27.962                     4.3981                        0.0098741                       11.835                      2.678                          0.39129                                 0.8893                                    0.3049                                      0.97295                                  0.30908                       0.40201                        111.06                          27.962                        -18.094                         2408.5                             -0.052692                                0.55415                             0.91083                        1.4376                          0.023078                               119.32                                 0.021376                                   108.52                                   0.030767                                   173.59                                 75.51                                   0.087674                                  710.23                                  0.79414                               0.896                       12.076                         0.15199                     4.243                       0.91189                           1.4316                              0.023109                                 119.34                                    0.021486                                       108.64                                      0.030465                                     172.87                                    301.76                                     0.087414                                     2836.1                                      0.79414                                 0.896                           12.083                           0.15192                        4.2827
[1] Vallières, Martin, Carolyn R. Freeman, Sonia R. Skamene, and Issam El Naqa. “A Radiomics Model from Joint FDG-PET and MRI Texture Features for the Prediction of Lung Metastases in Soft-Tissue Sarcomas of the Extremities.” The Cancer Imaging Archive, 2015. https://doi.org/10.7937/K9/TCIA.2015.7GO2GSKS.
[2] Vallières, M, C R Freeman, S R Skamene, and I El Naqa. “A Radiomics Model from Joint FDG-PET and MRI Texture Features for the Prediction of Lung Metastases in Soft-Tissue Sarcomas of the Extremities.” Physics in Medicine and Biology 60, no. 14 (July 7, 2015): 5471–96. https://doi.org/10.1088/0031-9155/60/14/5471.
[3] Clark, Kenneth, Bruce Vendt, Kirk Smith, John Freymann, Justin Kirby, Paul Koppel, Stephen Moore, et al. “The Cancer Imaging Archive (TCIA): Maintaining and Operating a Public Information Repository.” Journal of Digital Imaging 26, no. 6 (December 2013): 1045–57. https://doi.org/10.1007/s10278-013-9622-7.