Get Started with Signal Processing Toolbox
Signal Processing Toolbox™ provides functions and apps to manage, analyze, preprocess, and extract features from uniformly and nonuniformly sampled signals. The toolbox includes tools for filter design and analysis, resampling, smoothing, detrending, and power spectrum estimation. You can use the Signal Analyzer app to visualize and process signals simultaneously in time, frequency, and time-frequency domains. With the Filter Designer app, you can design and analyze FIR and IIR digital filters.
Using toolbox functions and the Signal Feature Extractor app, you can prepare signal datasets for AI model training by engineering features that reduce dimensionality and improve the quality of signals. With the Signal Labeler app, you can annotate signals in time and time-frequency domains to create labeled signal sets for training AI models. The toolbox supports GPU acceleration in addition to C/C++ and CUDA® code generation for desktop prototyping and embedded system deployment.
Tutorials
- Use Signal Analyzer App
Visualize, measure, analyze, and compare signals in the time, frequency, and time-frequency domains. - Align Signals with Different Start Times
Synchronize data collected by different sensors at different instants. - Compute Envelope Spectrum of Vibration Signal
Compute the envelope spectrum of a signal and combine app-generated scripts and functions into a single workflow. - Find Peaks in Data
Locate the local maxima in a set of data and determine if those peaks occur periodically. - Practical Introduction to Digital Filter Design
Use thedesignfiltfunction to design FIR and IIR filters based on frequency response specifications. - Practical Introduction to Digital Filtering
Design, analyze, and apply digital filters to remove unwanted content from a signal without distorting the data. - Practical Introduction to Frequency-Domain Analysis
Perform and interpret basic frequency-domain signal analysis using simulated and real data. - Practical Introduction to Time-Frequency Analysis
Perform and interpret basic time-frequency signal analysis of nonstationary signals. - Classify ECG Signals Using Long Short-Term Memory Networks
Classify heartbeat electrocardiogram data using deep learning and signal processing. - Waveform Segmentation Using Deep Learning
Segment human electrocardiogram signals using time-frequency analysis and deep learning.
Analyze Signals
Preprocess Signals
Find Patterns and Extract Features
Design, Analyze, and Apply Digital Filters
Perform Spectral and Time-Frequency Analysis
Apply Signal Processing to AI
Featured Examples

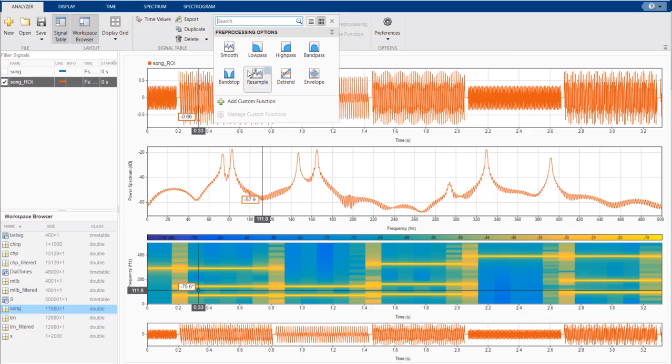
Extract Voices from Music Signal
Use Signal Analyzer to extract voices from a song by duplicating and filtering signals.

Process a Signal with Missing Samples
Signals often have missing samples. To provide estimates for these values, use resampling.

Find and Track Ridges Using Reassigned Spectrogram
Use the reassigned spectrogram in Signal Analyzer to sharpen the time and frequency localization of spectrograms.

Label Signal Attributes, Regions of Interest, and Points
Use Signal Labeler to label attributes, regions, and points of interest in a set of whale songs.

Automate Signal Labeling with Custom Functions
Use Signal Labeler to locate and label QRS complexes and R peaks of ECG signals.

Take Derivatives of a Signal
Use a differentiator filter to differentiate a signal without amplifying the noise.
Interactive Learning

Signal Processing Onramp
This free, two-hour tutorial provides an interactive introduction to practical signal processing methods for spectral analysis.
Videos

What Is Signal Processing Toolbox?
Perform signal processing, signal analysis, and algorithm development using
Signal Processing Toolbox.

Signal Processing and Machine Learning Techniques for Sensor Data
Analytics
This video presents a classification system able to identify the physical
activity of a human subject based on smartphone-generated accelerometer
signals.
Signal Analysis Made Easy with the Signal Analyzer App
Learn to perform signal analysis tasks in MATLAB® with the Signal Analyzer app.

Introduction to Signal Processing Apps in MATLAB
Use Signal Analyzer to import, visualize, preprocess, and analyze
an electrocardiogram signal.

Understanding the Discrete Fourier Transform and the FFT — MATLAB Tech Talks
Find answers to common questions about the discrete Fourier transform and the
FFT
algorithm.

A Practical Understanding of Power Spectral Density — MATLAB Tech Talks
Learn to scale the FFT to compute power spectra and power spectral
densities.
Teaching Resources
Digital Signal Processing: Signals and Filter Design
Learn the concepts behind analog and digital signals, filters, and filter designs, and apply your learning to build a filtering app.