Main Content

envelope

Signal envelope

Description

[yupper,ylower] = envelope(x) returns the upper and lower envelopes of the input sequence, x, as the magnitude of its analytic signal. The analytic signal of x is found using the discrete Fourier transform as implemented in hilbert. The function initially removes the mean of x and adds it back after computing the envelopes. If x is a matrix, then envelope operates independently over each column of x.

example

[yupper,ylower] = envelope(x,fl,'analytic') returns the envelopes of x determined using the magnitude of its analytic signal. The analytic signal is computed by filtering x with a Hilbert FIR filter of length fl. This syntax is used if you specify only two arguments.

example

[yupper,ylower] = envelope(x,wl,'rms') returns the upper and lower root-mean-square envelopes of x. The envelopes are determined using a sliding window of length wl samples.

example

[yupper,ylower] = envelope(x,np,'peak') returns the upper and lower peak envelopes of x. The envelopes are determined using spline interpolation over local maxima separated by at least np samples.

example

envelope(___) with no output arguments plots the signal and its upper and lower envelopes. This syntax accepts any of the input arguments from previous syntaxes.

example

Examples

collapse all

Generate a quadratic chirp modulated by a Gaussian. Specify a sample rate of 2 kHz and a signal duration of 2 seconds.

t = 0:1/2000:2-1/2000;
q = chirp(t-2,4,1/2,6,'quadratic',100,'convex').*exp(-4*(t-1).^2);
plot(t,q)

Figure contains an axes object. The axes object contains an object of type line.

Compute the upper and lower envelopes of the chirp using the analytic signal.

[up,lo] = envelope(q);
hold on
plot(t,up,t,lo,'linewidth',1.5)
legend('q','up','lo')
hold off

Figure contains an axes object. The axes object contains 3 objects of type line. These objects represent q, up, lo.

The signal is asymmetric due to the nonzero mean.

Use envelope without output arguments to plot the signal and envelopes as a function of sample number.

envelope(q)

Figure contains an axes object. The axes object with title Analytic Envelope contains 3 objects of type line. These objects represent signal, envelope.

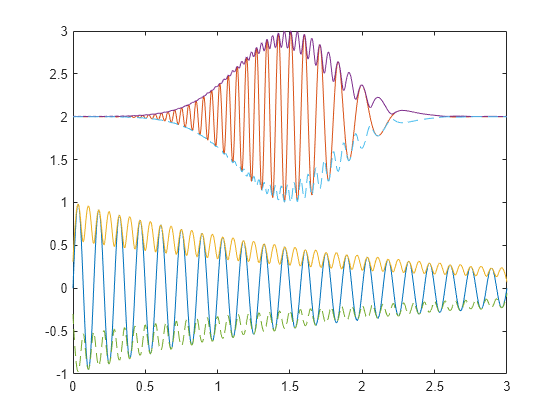
Create a two-channel signal sampled at 1 kHz for 3 seconds:

  • One channel is an exponentially decaying sinusoid. Specify a frequency of 7 Hz and a time constant of 2 seconds.

  • The other channel is a time-displaced Gaussian-modulated chirp with a DC value of 2. Specify an initial chirp frequency of 30 Hz that decays to 5 Hz after 2 seconds.

Plot the signal.

t = 0:1/1000:3;
q1 = sin(2*pi*7*t).*exp(-t/2);
q2 = chirp(t,30,2,5).*exp(-(2*t-3).^2)+2;
q = [q1;q2]';

plot(t,q)

Figure contains an axes object. The axes object contains 2 objects of type line.

Compute the upper and lower envelopes of the signal. Use a Hilbert filter with a length of 100. Plot the channels and the envelopes. Use solid lines for the upper envelopes and dashed lines for the lower envelopes.

[up,lo] = envelope(q,100,'analytic');
hold on
plot(t,up,'-',t,lo,'--')
hold off

Figure contains an axes object. The axes object contains 6 objects of type line.

Call envelope without output arguments to produce a plot of the signal and its envelopes as a function of sample number. Increase the filter length to 300 to obtain a smoother shape. The 'analytic' flag is the default when you specify two input arguments.

envelope(q,300)

Figure contains an axes object. The axes object with title Analytic Envelope contains 6 objects of type line.

Compute and plot the moving RMS envelopes of a recording of a train whistle. Use a window with a length of 150 samples.

load('train')

envelope(y,150,'rms')

Figure contains an axes object. The axes object with title RMS Envelope contains 3 objects of type line. These objects represent signal, envelope.

Plot the upper and lower peak envelopes of a speech signal smoothed over 30-sample intervals.

load('mtlb')

envelope(mtlb,30,'peak')

Figure contains an axes object. The axes object with title Peak Envelope contains 3 objects of type line. These objects represent signal, envelope.

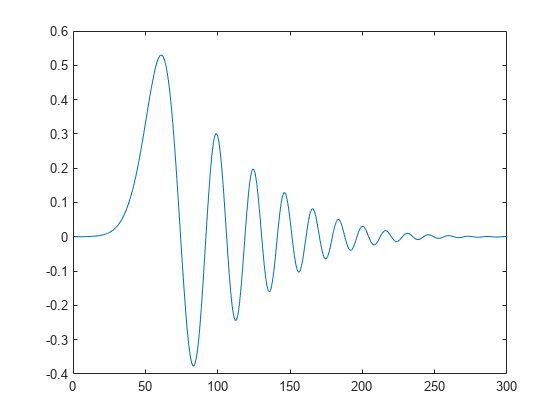
Create and plot a signal that resembles the initial detection of a light pulse propagating through a dispersive medium.

t = 0.5:-1/100:-2.49;
z = airy(t*10).*exp(-t.^2);

plot(z)

Figure contains an axes object. The axes object contains an object of type line.

Determine the envelopes of the sequence using the magnitude of its analytic signal. Plot the envelopes.

envelope(z)

Figure contains an axes object. The axes object with title Analytic Envelope contains 3 objects of type line. These objects represent signal, envelope.

Compute the analytic envelope of the signal using a 50-tap Hilbert filter.

envelope(z,50,'analytic')

Figure contains an axes object. The axes object with title Analytic Envelope contains 3 objects of type line. These objects represent signal, envelope.

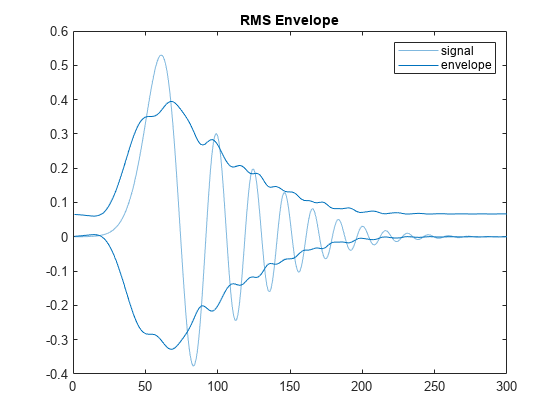
Compute the RMS envelope of the signal using a 40-sample moving window. Plot the result.

envelope(z,40,'rms')

Figure contains an axes object. The axes object with title RMS Envelope contains 3 objects of type line. These objects represent signal, envelope.

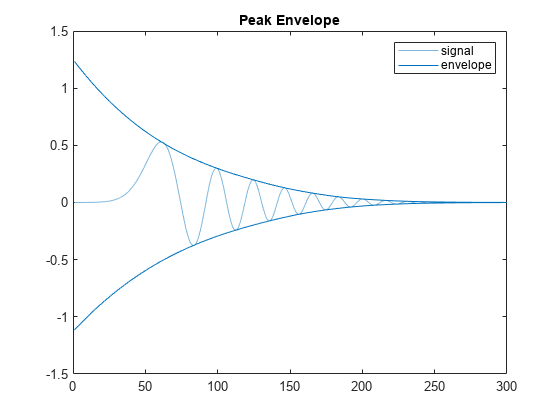
Determine the peak envelopes. Use spline interpolation with not-a-knot conditions over local maxima separated by at least 10 samples.

envelope(z,10,'peak')

Figure contains an axes object. The axes object with title Peak Envelope contains 3 objects of type line. These objects represent signal, envelope.

Input Arguments

collapse all

Input sequence, specified as a vector or matrix. If x is a vector, it is treated as a single channel. If x is a matrix, then envelope computes the envelope estimates independently for each column. All elements of x must be finite.

Example: cos(pi/4*(0:159))+randn(1,160) is a single-channel row-vector signal.

Example: cos(pi./[4;2]*(0:159))'+randn(160,2) is a two-channel signal.

Data Types: single | double

Hilbert filter length, specified as a positive integer scalar. The filter is created by windowing an ideal brick-wall filter with a Kaiser window of length fl and shape parameter β = 8.

Data Types: single | double

Window length, specified as a positive integer scalar.

Data Types: single | double

Peak separation, specified as a positive integer scalar.

Data Types: single | double

Output Arguments

collapse all

Upper and lower signal envelopes, returned as vectors or matrices.

Extended Capabilities

Version History

Introduced in R2015b