Review Test Generation Analysis Results
Review analysis results after Simulink® Design Verifier™ completes the analysis in one of these ways:
Highlight results in the model.
View an analysis report.
Review Test Generation Analysis Results
Complete the first two steps of this tutorial to perform test generation analysis and then review the results.
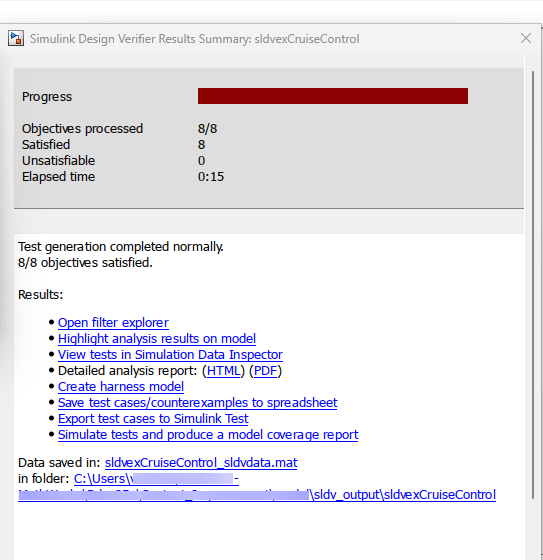
When the software completes its analysis, the Results Summary window displays options for reviewing the results. For any Simulink Design Verifier analysis, you can perform tasks from the Results Summary window.
Alternatively, on the Design Verifier tab, click Results Summary in the Review Results section to view the results.
As long as your model remains open, you can view the results of your most recent Simulink Design Verifier analysis in the Results Summary window.
Highlight Analysis Results on Model
During analysis, Simulink Design Verifier highlights the model objects automatically when the objectives status is updated.
To highlight the analysis results on the sldvexCruiseControl model:
1. In the Results Summary window for the sldvexCruiseControl analysis, click Highlight analysis results on model.
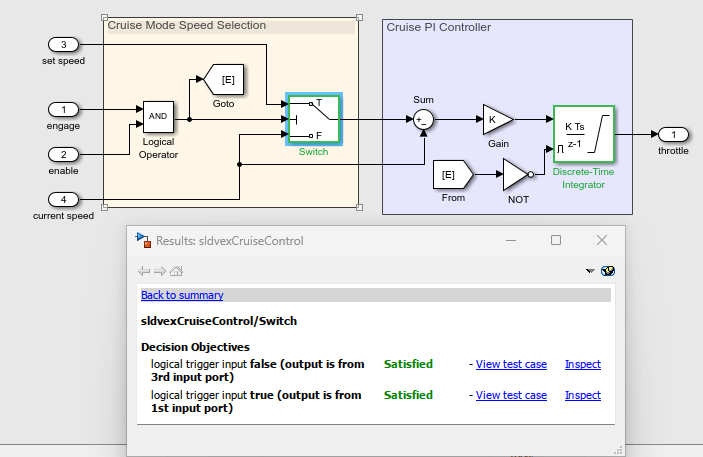
The Switch block is highlighted in green, which indicates that the Switch block has test cases that satisfy its test objectives.
2. By default, the Simulink Design Verifier Results window is always the topmost visible window. To allow the window to move behind other window, right-click the window and clear Always on top. As you click objects in the model, this window changes to display detailed analysis results for that object.
3. Click the highlighted Switch block.
The summary shows that all the objectives of the Switch block are satisfied. Similarly, click the highlighted Discrete-Time Integrator block to see analysis results for this block in the Simulink Design Verifier Results window. For more information about highlighted analysis results on a model, see Highlight Results on the Model.
Review Detailed Analysis Report
In the Simulink Design Verifier Results Summary window, next to Detailed analysis report, click HTML. The HTML report opens in the MATLAB® Editor.
The report includes this table of contents.

The Summary chapter lists information about the model and the status of the objectives—satisfied or not.
The Analysis Information chapter provides information about:
The model that you analyzed.
The options that you specified for the analysis.
Approximations the software performed during the analysis.
The Test Objectives Status chapter in the HTML report includes detailed descriptions of satisfied objectives for each model item and generated test case.
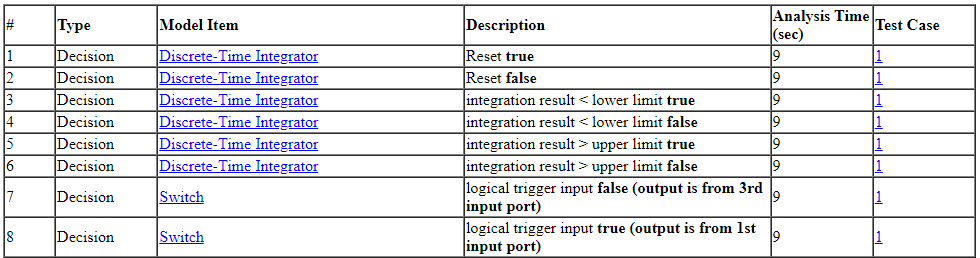
Under the table Test Case column, click 1 to display the Test Case 1 section.
The Test Objective Status section in the report provides details about a test case that the analysis generated to achieve an objective in your model. For more information about the HTML reports, see Review Results from Analysis Report.
Review Harness Model
To view the test case for a model coverage objective, in the Simulink Design Verifier Results window, click View test case. The harness model sldvexCruiseControl_harness and the Signal Editor block opens.
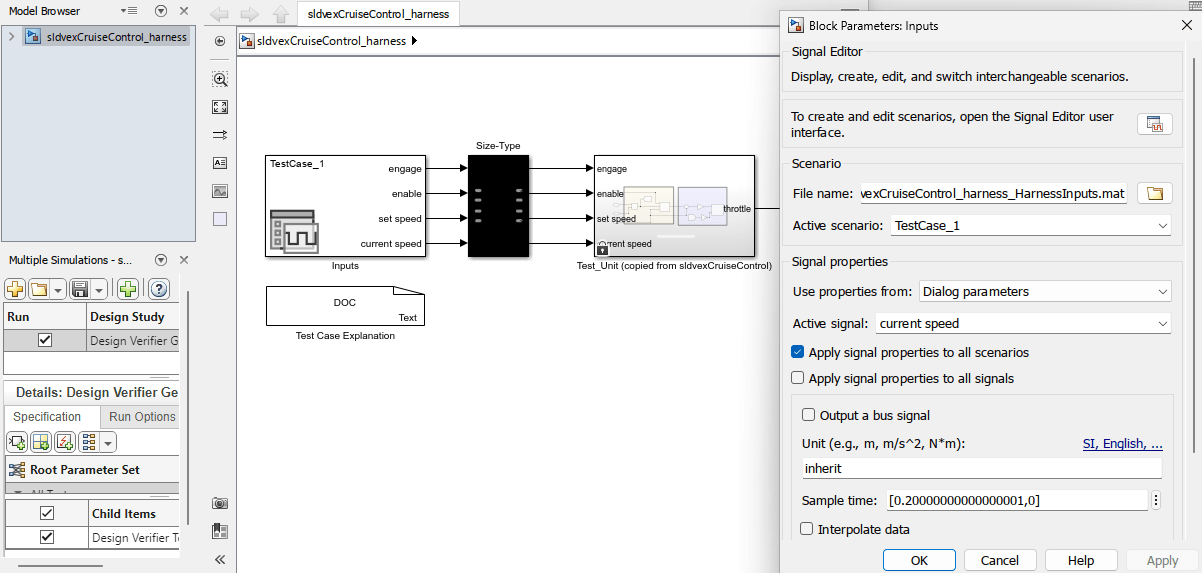
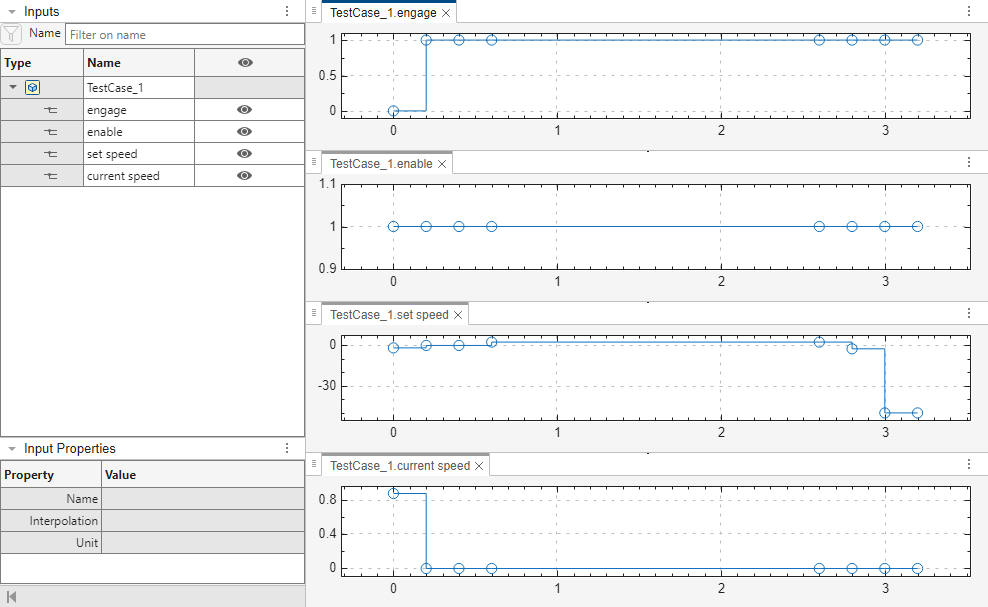
The Signal Editor block named Inputs contains the test cases. Double-click the Inputs block to see the test case.
Note: If you have a large model, the analysis can produce a harness model that contains a large number of test cases.
To generate fewer test cases, set the Test suite optimization model configuration parameter to LongTestcases and rerun the analysis.
When you set Test suite optimization to LongTestcases, the analysis generates fewer but longer test cases that each satisfy multiple test objectives.
Simulate Harness Model and Produce a Model Coverage Report
Simulate the harness model using the generated test cases in the sldvexCruiseControl_harness harness model.
In the harness model, double-click the Inputs block to open the Block Parameters dialog box, then click the Open Signal Editor button to open Signal Editor window.
In the model harness window, click Run all.
The software simulates the harness model using both test cases, collects model coverage information, and displays a coverage report. The coverage report indicates that the test cases record 100% decision coverage for the sldvexCruiseControl model.
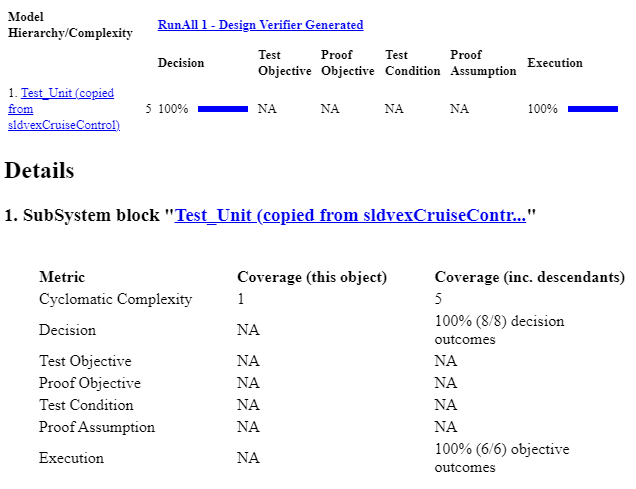
You can also simulate the model without creating a harness model. In the Simulink Design Verifier log window, click Simulate tests and produce a model coverage report. For more information about model coverage, see Top-Level Model Coverage Report (Simulink Coverage).
For more information about the harness model and about using the Signal Editor block to produce a model coverage report, see Use Harness Model for Test Simulations.
View sldvData File
The Simulink Design Verifier data file is a MAT File that contains a structure named sldvData. This structure stores all the data that the analysis gathers and produces during the analysis. You can use the data file to conduct your own analysis or to generate a custom report.
To view the data file, click the data file name in the log window, which in this example is sldvexGenerateTestcasesExample_sldvdata.mat. When you click the data file name, the software creates a copy of the sldvData object in the MATLAB workspace so that you can review and manipulate the data.
For more information about Simulink Design Verifier data files, see View and Understand Analysis Results from Data Files.
See Also
Workflow for Test Generation | Analyze Model and Interpret Results | Check Model Compatibility for Analysis | Highlight Results on the Model