Detect Changes in Data and Expression Values
Stateflow® charts can detect changes in the values of data and expressions between time steps. You can:
Use change detection operators to determine when a variable changes to or from a value.
Use edge detection operators to determine when an expression rises above or falls below a threshold.
To generate an implicit local event when the chart sets the value of a
variable, use the change operator. For more
information, see Control Chart Behavior by Using Implicit Events.
Change Detection Operators
To detect changes in Stateflow data, use the operators listed in this table.
| Operator | Syntax | Description | Example |
|---|---|---|---|
hasChanged | tf = hasChanged(data_name) | Returns 1 (true) if the value of
data_name at the beginning of the current time step is
different from the value of data_name at the beginning of the
previous time step. Otherwise, the operator returns 0
(false). | Transition out of state if any element of the matrix
[hasChanged(M)] |
Transition out of state if the element in row 1 and column 3 of the
matrix In charts that use MATLAB® as the action language, use: [hasChanged(M(1,3))] In charts that use C as the action language, use: [hasChanged(M[0][2])] | |||
hasChangedFrom | tf = hasChangedFrom(data_name,value) | Returns 1 (true) if the value of
data_name was equal to the specified value
at the beginning of the previous time step and is a different value at the
beginning of the current time step. Otherwise, the operator returns 0
(false). | Transition out of state if the previous value of the structure
[hasChangedFrom(struct,structValue)] |
hasChangedTo | tf = hasChangedTo(data_name,value) | Returns 1 (true) if the value of
data_name was not equal to the specified
value at the beginning of the previous time step and is equal
to value at the beginning of the current time step. Otherwise,
the operator returns 0 (false). | Transition out of state if the structure field
[hasChangedTo(struct.field,5)] |
Note
If multiple input events occur in the same time step, these operators can detect changes in data value between input events.
Example of Chart with Change Detection
This model shows how the operators hasChanged, hasChangedFrom, and hasChangedTo detect specific changes in an input signal. In this example, a Ramp (Simulink) block sends a discrete, increasing time signal to a chart.
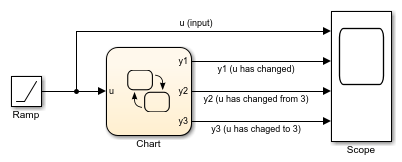
The model uses a fixed-step solver with a step size of 1. The signal increments by 1 every time step. The chart analyzes the input signal u for these changes:
Any change from the previous time step
A change to the value 3
A change from the value 3
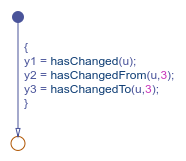
To check the signal, the chart calls three change detection operators in a transition action. The chart outputs the return values as y1, y2, and y3.
During simulation, the Scope (Simulink) block shows the input and output signals for the chart.
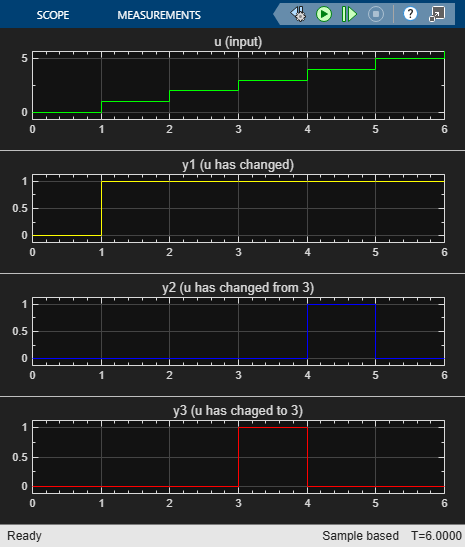
The value of
uincreases by 1 every time step.The value of
y1changes from 0 to 1 at timet = 1. The value ofy1remains 1 becauseucontinues to change at each subsequent time step.The value of
y2changes from 0 to 1 at timet = 4when the value ofuchanges from 3 to 4. The value ofy2returns to 0 after one time step.The value of
y3changes from 0 to 1 at timet = 3when the value ofuchanges from 2 to 3. The value ofy3returns to 0 after one time step.
Limitations of Change Detection
The type of Stateflow chart determines the scope of the data supported for change detection:
Standalone Stateflow charts in MATLAB:
LocalonlyCharts in Simulink® that use MATLAB as the action language:
InputonlyCharts in Simulink that use C as the action language:
Input,Output,Local, orData Store Memory
The argument data_name can be:
A scalar variable.
A matrix or an element of a matrix.
If
data_nameis a matrix, the operator returnstruewhen it detects a change in any element ofdata_name.Index elements of a matrix by using numbers or expressions that evaluate to a constant integer. For more information, see Operations for Vectors and Matrices in Stateflow.
A structure or a field in a structure.
If
data_nameis a structure, the change detection operator returnstruewhen it detects a change in any field ofdata_name.Index fields in a structure by using dot notation. For more information, see Index and Assign Values to Stateflow Structures.
Any valid combination of structure fields or matrix elements.
The argument data_name cannot be a nontrivial expression
or a custom code variable.
Note
Standalone charts in MATLAB do not support change detection on an element of a matrix or a field in a structure.
For the hasChangedFrom and hasChangedTo
operators, the argument value can be any expression that resolves to a
value that is comparable with data_name.
If
data_nameis a scalar, thenvaluemust resolve to a scalar value.If
data_nameis a matrix, thenvaluemust resolve to a matrix value with the same dimensions asdata_name.Alternatively, in a chart that uses C as the action language,
valuecan resolve to a scalar value. The chart uses scalar expansion to comparedata_nameto a matrix whose elements are all equal to the value specified byvalue. For more information, see Assign Values to All Elements.If
data_nameis a structure, thenvaluemust resolve to a structure value whose field specification matchesdata_nameexactly.
If you enable row-major array layout, charts that use change detection operators on non-scalar values will not support code generation. To generate code, enable column-major array layout. For more information, see Select Array Layout for Matrices in Generated Code.
Edge Detection Operators
To determine when an expression rises above or falls below a threshold, use the operators listed in this table.
| Operator | Syntax | Description | Example |
|---|---|---|---|
crossing | tf = crossing(expression) | Returns 1 (
Otherwise, the operator returns 0
( This operator imitates the behavior of a
Trigger (Simulink) block with Trigger
Type set to | Transition out of state if the value of the input data
[crossing(signal-2.5)] The
edge is detected when the value of the expression |
falling | tf = falling(expression) | Returns 1 (
Otherwise, the operator returns 0
( This operator imitates the behavior of a
Trigger (Simulink) block with Trigger
Type set to | Transition out of state if the value of the input data
[falling(signal-2.5)] The
falling edge is detected when the value of the expression
|
rising | tf = rising(expression) | Returns 1 (
Otherwise, the operator returns 0
( This operator imitates the behavior of a
Trigger (Simulink) block with Trigger
Type set to | Transition out of state if the value of the input data
[rising(signal-2.5)] The
rising edge is detected when the value of the expression
|
Note
Like the Trigger block, these operators detect a single edge when the
expression argument changes value from positive to zero to negative
or from negative to zero to positive at three consecutive time steps. The edge occurs when
the value of the expression becomes zero.
Example of Chart with Edge Detection
This model shows how the operators crossing, falling, and rising detect edges in an input signal. In this example, a Pulse Generator (Simulink) block sends a square wave to a chart.
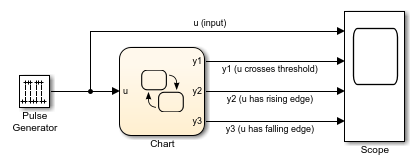
The model uses a fixed-step solver with a step size of 1. The value of the input signal u alternates between 0 and 5 every two time steps. The chart analyzes the input signal u for these edges:
A falling or rising edge crossing the threshold of 2.5
An edge rising over the threshold of 2.5
An edge falling under the threshold of 2.5
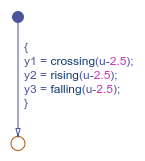
To check the signal, the chart calls three edge detection operators in a transition action. The chart outputs the return values as y1, y2, and y3.
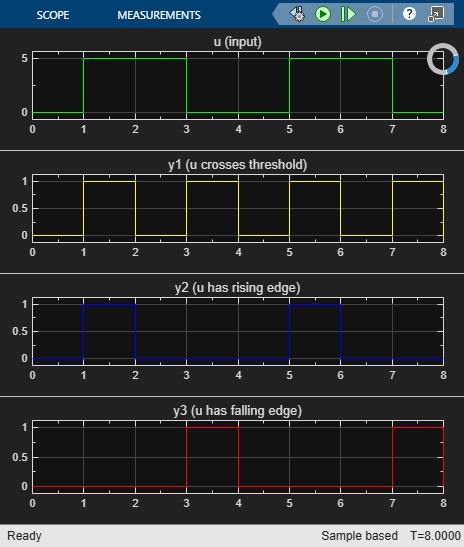
During simulation, the Scope (Simulink) block shows the input and output signals for the chart.
The value of
ualternates between 0 and 5 at every other time step.The value of
y1changes from 0 to 1 at timet = 1,3,5, and7, when the value of the expressionu-2.5changes sign. The value ofy1returns to 0 after one time step.The value of
y2changes from 0 to 1 at timet = 1and5, when the value of the expressionu-2.5changes from negative to positive. The value ofy2returns to 0 after one time step.The value of
y3changes from 0 to 1 at timet = 3and7, when the value of the expressionu-2.5changes from positive to negative. The value ofy3returns to 0 after one time step.
Limitations of Edge Detection
Edge detection is supported only in Stateflow charts in Simulink models.
The argument expression:
Must be a scalar-valued expression
Can combine chart input data, constants, nontunable parameters, continuous-time local data, and state data from Simulink based states
Can include addition, subtraction, and multiplication of scalar variables, elements of a matrix, fields in a structure, or any valid combination of structure fields and matrix elements
Index elements of a matrix by using numbers or expressions that evaluate to a constant integer.
Edge detection for continuous-time local data and state data from Simulink based states is supported only in transition conditions.
In atomic subcharts, map all input data that you use in edge detection expressions to input data or nontunable parameters in the main chart. Mapping these input data to output data, local data, or tunable parameters can result in undefined behavior.
Stateflow charts that use edge detection operators do not support operating points.
If you enable row-major array layout, charts that use edge detection operators on non-scalar values will not support code generation. To generate code, enable column-major array layout. For more information, see Select Array Layout for Matrices in Generated Code.
Implementation of Change and Edge Detection
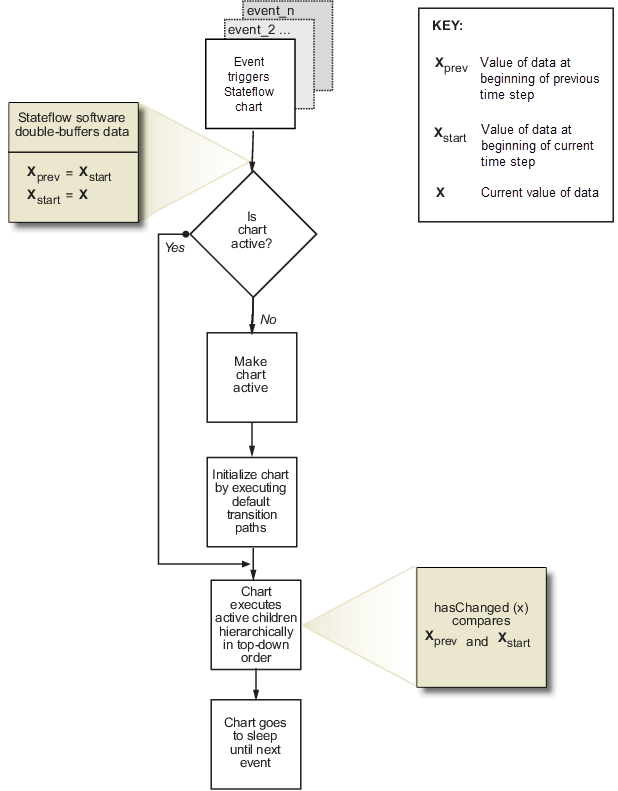
A chart detects changes in chart data and expressions by evaluating the values at time step boundaries. The chart compares the value at the beginning of the previous execution step with the value at the beginning of the current execution step.
For example, when you invoke the hasChanged operator with an argument
of x, the Stateflow chart double-buffers the values of x in local variables
that are inaccessible to the user.
| Local Buffer | Description |
|---|---|
x_prev | Value of data |
x_start | Value of data |
To detect changes, the chart double-buffers data values after an
event triggers the chart but before the chart begins execution. If the
values of xprev and
xstart match, the change detection operator
returns false to indicate that no change occurred; otherwise, it returns
true to indicate a change. This diagram places these tasks in the
context of the chart life cycle.
Edge detection operators behave in a similar way, except that they compare the value of
an expression at the beginning of the last time step
(xprev) with its current value
(x). The difference in implementation allows continuous-time charts to
detect edges in local data during minor time steps.
Transient Value Changes in Local Data
The change detection operators attempt to filter out transient changes in local chart
variables by evaluating their values only at time boundaries. The chart evaluates the
specified local variable only once at the end of the execution step. The return value of
the change detection operators remains constant even if the value of the local variable
fluctuates within a given time step. For example, suppose that in the current time step,
the local variable temp changes from its value at the previous time
step but then reverts to the original value. The operator
hasChanged(temp) returns false for the next time
step, indicating that no change occurred.
In contrast, the edge detection operators can detect edges in continuous-time local
data during minor time steps. For example, suppose that p is a
continuous-time local variable with a negative derivative. Then the operator
falling(p) returns true during the minor time step
when p changes sign from positive to negative.
Detect Value Changes Between Input Events or Super Step Iterations
When multiple input events occur in the same time step, or when you enable super step
semantics, the chart updates the xprev and
xstart buffers every time it executes. The
chart detects changes in value between input events and super step iterations even if the
changes occur more than once in a given time step. For more information, see Use Events to Execute Charts
and Super Step Semantics.
See Also
change | crossing | falling | hasChanged | hasChangedFrom | hasChangedTo | rising