falling
Syntax
Description
tf = falling( returns 1
(expression)true) if:
The previous value of
expressionwas positive and its current value is zero or negative.The previous value of
expressionwas zero and its current value is negative.
Otherwise, the operator returns 0 (false). If
expression changes value from positive to zero to negative at
three consecutive time steps, the operator detects a single edge when the value of
expression becomes zero.
The argument expression:
Must be a scalar-valued expression
Can combine chart input data, constants, nontunable parameters, continuous-time local data, and state data from Simulink® based states
Can include addition, subtraction, and multiplication of scalar variables, elements of a matrix, fields in a structure, or any valid combination of structure fields and matrix elements
Index elements of a matrix by using numbers or expressions that evaluate to a constant integer.
Note
Edge detection is supported only in Stateflow® charts in Simulink models.
Examples
Transition out of state if the value of the input data
signal falls below a threshold of 2.5.
[falling(signal-2.5)]
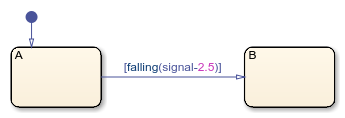
The falling edge is detected when the value of the expression
signal-2.5 becomes zero or negative.
Tips
You cannot use the
fallingoperator inside a Simulink model that generates code using row-major array layout. For more information on row-major layout, see Select Array Layout for Matrices in Generated Code.The
fallingoperator imitates the behavior of a Trigger (Simulink) block with Trigger Type set tofalling.Edge detection for continuous-time local data and state data from Simulink based states is supported only in transition conditions.
In atomic subcharts, map all input data that you use in edge detection expressions to input data or nontunable parameters in the main chart. Mapping these input data to output data, local data, or tunable parameters can result in undefined behavior.
Version History
Introduced in R2021b