Cluster Data
Cluster data using k-means or hierarchical clustering in the Live Editor
Since R2021b
Description
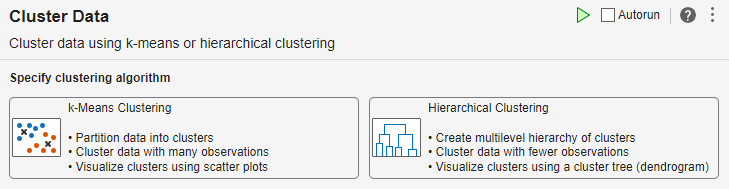
The Cluster Data Live Editor Task enables you to interactively perform k-means or hierarchical clustering. The task generates MATLAB® code for your live script and returns the resulting cluster indices to the MATLAB workspace. If you perform k-means clustering, the task also returns the cluster centroid locations.
You can:
Specify the number of clusters manually. For hierarchical clustering, you can specify the cutoff for the underlying hierarchical cluster tree.
Determine the optimal number of clusters for your data automatically by specifying criteria such as gap values, silhouette values, Davies-Bouldin index values, and Calinski-Harabasz index values.
Customize the parameters for clustering your data, such as the distance metric to use.
Automatically visualize the clustered data.
For general information about Live Editor tasks, see Add Interactive Tasks to a Live Script.
Open the Task
To add the Cluster Data task to a live script:
On the Live Editor tab, select Task > Cluster Data.
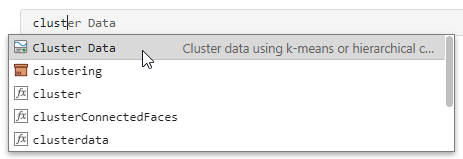
In a code block in the live script, type a relevant keyword, such as
clustering,kmeans, orhierarchical. Select Cluster Data from the suggested command completions.
Examples
This example shows how to use the Cluster Data task to interactively perform k-means clustering for a specified number of clusters.
Load the sample data. The data contains length and width measurements from the sepals and petals of three species of iris flowers.
load fisheririsOpen the Cluster Data task. To open the task, begin
typing the keyword clustering in a code block and select
Cluster Data from the suggested command completions.
In the task, select the k-Means Clustering algorithm. (since R2024a)
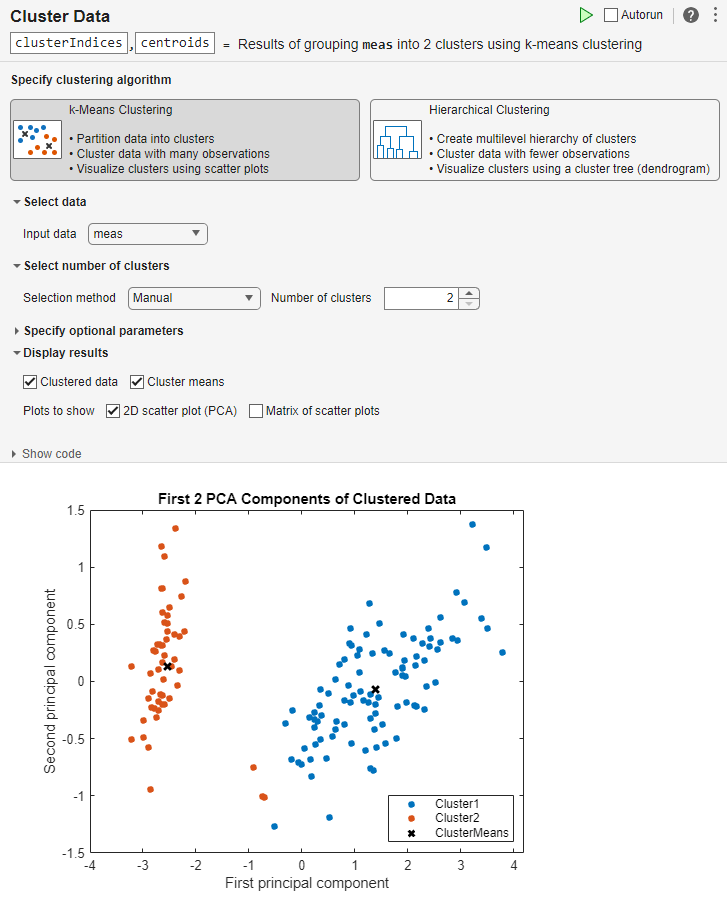
Cluster the data into two clusters.
Select the
measvariable as the input data.Set the number of clusters to
2, if necessary.In the Live Editor tab, click the
 Run button to run the task.
MATLAB displays the clustered data and the cluster means in a scatter plot.
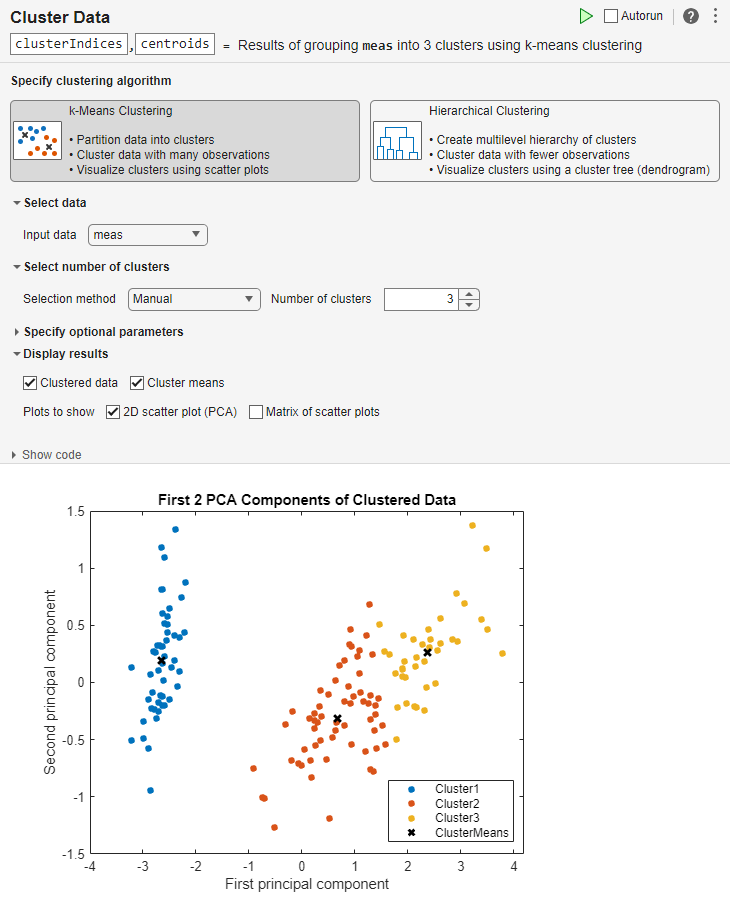
Increase the number of clusters to 3 and rerun the task.
MATLAB displays the updated clustered data and the cluster means in a scatter
plot.
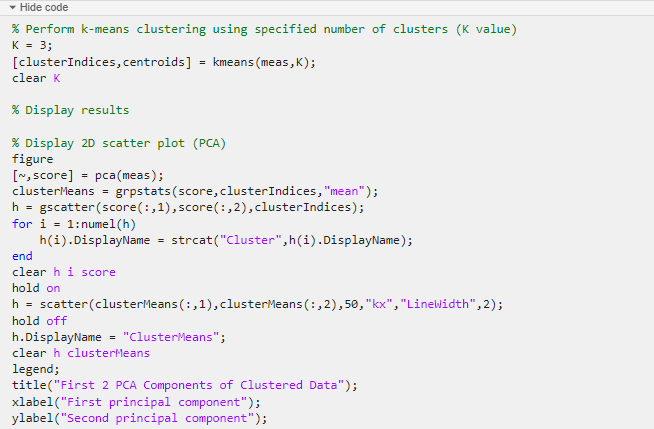
The task generates code in your live script. The generated code reflects the parameters and options that you select, and includes code to generate the scatter plot. To see the generated code, click Show code at the bottom of the task parameter area. The task expands to display the generated code.
By default, the generated code uses clusterIndices and
centroids as the name of the output variables returned to the
MATLAB workspace. The clusterIndices vector is a numeric
column vector containing the cluster indices. Each row in
clusterIndices indicates the cluster assignment of the
corresponding observation. The centroids matrix is a numeric matrix
containing the cluster centroid locations. To specify a different output variable name,
enter a new name in the summary line at the top of the task. For instance, change the
two variable names to c_indices and
c_locations.

When the task runs, the generated code is updated to reflect the new variable names.
The new variables c_indices and c_locations appear
in the MATLAB workspace.
This example shows how to use the Cluster Data task to interactively evaluate clustering solutions based on selected criteria.
Load the sample data. The data contains length and width measurements from the sepals and petals of three species of iris flowers.
load fisheririsOpen the Cluster Data task. To open the task, begin
typing the keyword clustering in a code block and select
Cluster Data from the suggested command completions.
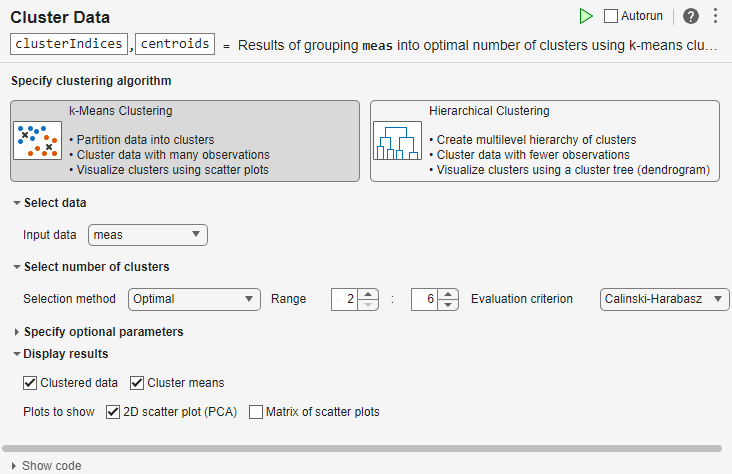
In the task, select the k-Means Clustering algorithm. (since R2024a)
Evaluate the optimal number of clusters.
Select the
measvariable as the input data.Set the number of clusters selection method to
Optimal.Set the range min and max to
2and6.In the Live Editor tab, click the
Run button to run the task.
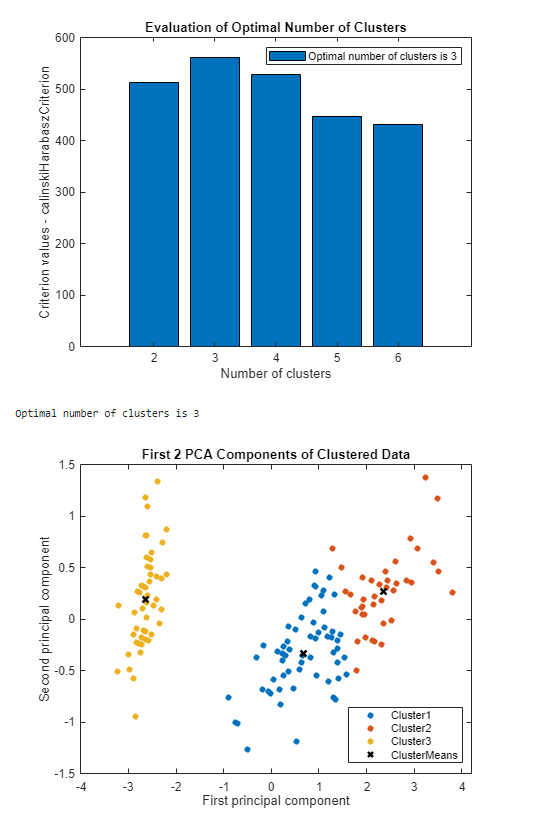
MATLAB displays a bar chart with evaluation results, indicating that, based on the Calinski-Harabasz criterion, the optimal number of clusters is 3. A scatter plot shows the clustered data and the cluster means using the optimal number of clusters, 3. Your results might differ.
Since R2024a
This example shows how to use the Cluster Data task to interactively perform hierarchical clustering for a specified cluster tree cutoff.
Load the sample data. The data contains length and width measurements from the sepals and petals of three species of iris flowers.
load fisheririsOpen the Cluster Data task. To open the task, begin
typing the keyword clustering in a code block and select
Cluster Data from the suggested command completions.
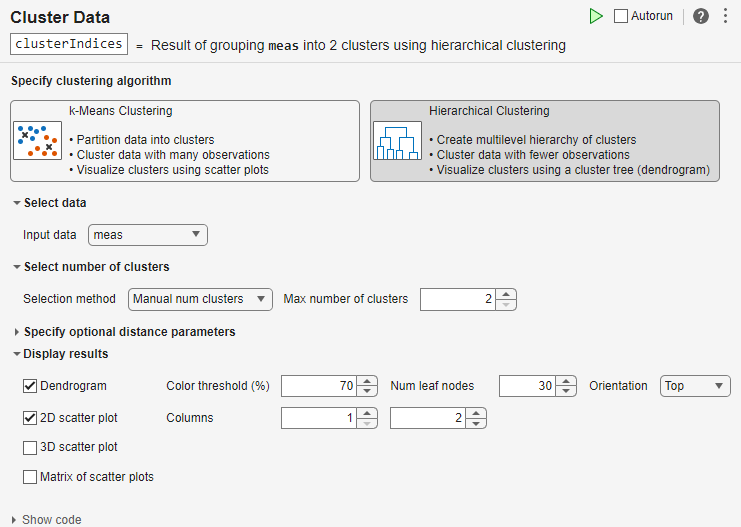
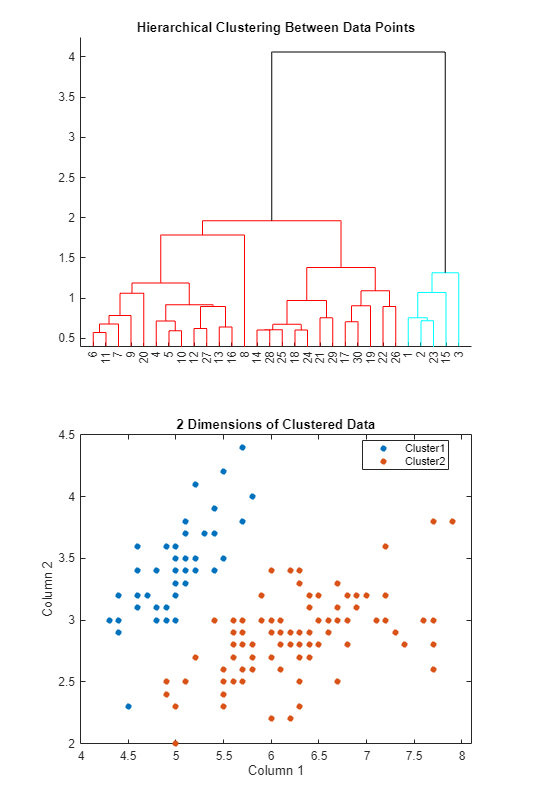
In the task, select the Hierarchical Clustering algorithm.
Cluster the data using the default number of clusters.
Select the
measvariable as the input data.Set the maximum number of clusters to
2, if necessary.In the Live Editor tab, click the
Run button to run the task.
MATLAB displays the cluster tree in a dendrogram and the clustered data in a scatter plot.
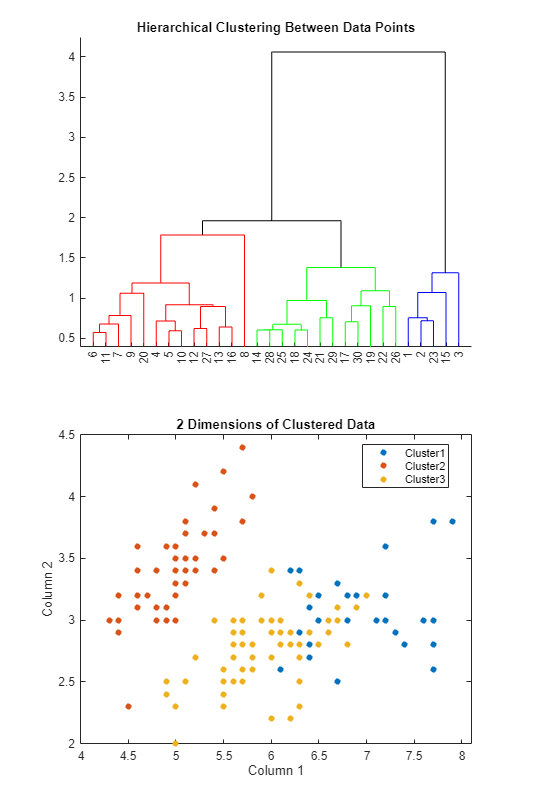
Use a cutoff to split the data into three clusters and rerun the task.
Set the selection method for the number of clusters to
Manual cutoff.Set the threshold to
1.8and the cluster criterion toDistance. The previous dendrogram shows that this cutoff value splits the hierarchical cluster tree into three clusters.In the Live Editor tab, click the
Run button to run the task.
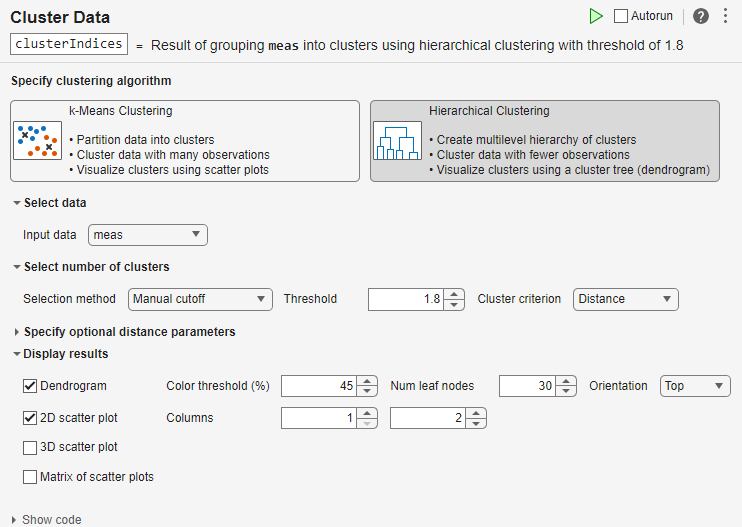
MATLAB displays the updated dendrogram and scatter plot.
The task generates code in your live script. The generated code reflects the parameters and options that you select, and includes code to generate the scatter plot. To see the generated code, click Show code at the bottom of the task parameter area. The task expands to display the generated code.
By default, the generated code uses clusterIndices as the name of
the output variable returned to the MATLAB workspace. The clusterIndices vector is a numeric
column vector containing the cluster indices. Each row in
clusterIndices indicates the cluster assignment of the
corresponding observation. To specify a different output variable name, enter a new name
in the summary line at the top of the task. For instance, change the variable name to
c_indices.
When the task runs, the generated code is updated to reflect the new variable name.
The new variable c_indices appears in the MATLAB workspace.
Related Examples
Parameters
Tips
By default, the Cluster Data task does not automatically run when you modify the task parameters. To have the task run automatically after any change, select the Autorun box at the top right of the task. If your data set is large, do not enable this option.
Version History
Introduced in R2021bSee Also
kmeans | evalclusters | scatter | gscatter | gplotmatrix | pca | pdist | linkage | cluster | dendrogram | scatter3