isanomaly
Syntax
Description
tf = isanomaly(Mdl,Tbl)Tbl using the OneClassSVM object
Mdl and returns the logical array tf, whose
elements are true when an anomaly is detected in the corresponding row of
Tbl. You must use this syntax if you create Mdl
by passing a table to the ocsvm
function.
tf = isanomaly(___,ScoreThreshold=scoreThreshold)isanomaly identifies observations with scores
above scoreThreshold as anomalies.
Examples
Create a OneClassSVM object for uncontaminated training observations by using the ocsvm function. Then detect novelties (anomalies in new data) by passing the object and the new data to the object function isanomaly.
Load the 1994 census data stored in census1994.mat. The data set consists of demographic data from the US Census Bureau to predict whether an individual makes over $50,000 per year.
load census1994census1994 contains the training data set adultdata and the test data set adulttest.
ocsvm does not use observations with missing values. Remove missing values in the data sets to reduce memory consumption and speed up training.
adultdata = rmmissing(adultdata);
adulttest = rmmissing(adulttest);
Train a one-class SVM for adultdata. Assume that adultdata does not contain outliers. Specify StandardizeData as true to standardize the input data, and set KernelScale to "auto" to let the function select an appropriate kernel scale parameter using a heuristic procedure.
rng("default") % For reproducibility
[Mdl,~,s] = ocsvm(adultdata,StandardizeData=true,KernelScale="auto");
Mdl is a OneClassSVM object. If you do not specify the ContaminationFraction name-value argument as a value greater than 0, then ocsvm treats all training observations as normal observations. The function sets the score threshold to the maximum score value. Display the threshold value.
Mdl.ScoreThreshold
ans =
0.0322
Find anomalies in adulttest by using the trained one-class SVM model. Because you specified StandardizeData=true when you trained the model, the isanomaly function standardizes the input data by using the predictor means and standard deviations of the training data stored in the Mu and Sigma properties, respectively.
[tf_test,s_test] = isanomaly(Mdl,adulttest);
The isanomaly function returns the anomaly indicators tf_test and scores s_test for adulttest. By default, isanomaly identifies observations with scores above the threshold (Mdl.ScoreThreshold) as anomalies.
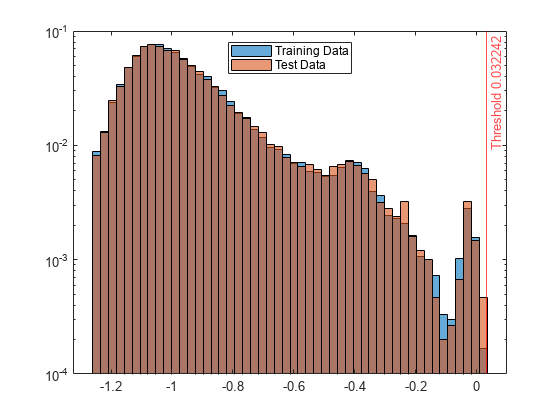
Create histograms for the anomaly scores s and s_test. Create a vertical line at the threshold of the anomaly scores.
h1 = histogram(s,NumBins=50,Normalization="probability");
hold on
h2 = histogram(s_test,h1.BinEdges,Normalization="probability");
xline(Mdl.ScoreThreshold,"r-",join(["Threshold" Mdl.ScoreThreshold]))
h1.Parent.YScale = 'log';
h2.Parent.YScale = 'log';
legend("Training Data","Test Data",Location="north")
hold off
Display the observation index of the anomalies in the test data.
find(tf_test)
ans =

  0×1 empty double column vector
The anomaly score distribution of the test data is similar to that of the training data, so isanomaly does not detect any anomalies in the test data with the default threshold value. You can specify a different threshold value by using the ScoreThreshold name-value argument. For an example, see Specify Anomaly Score Threshold.
Specify the threshold value for anomaly scores by using the ScoreThreshold name-value argument of isanomaly.
Load the 1994 census data stored in census1994.mat. The data set consists of demographic data from the US Census Bureau to predict whether an individual makes over $50,000 per year.
load census1994census1994 contains the training data set adultdata and the test data set adulttest.
ocsvm does not use observations with missing values. Remove missing values in the data sets to reduce memory consumption and speed up training.
adultdata = rmmissing(adultdata);
adulttest = rmmissing(adulttest);
Train a one-class SVM model for adultdata. Specify StandardizeData as true to standardize the input data, and set KernelScale to "auto" to let the function select an appropriate kernel scale parameter using a heuristic procedure.
rng("default") % For reproducibility
[Mdl,~,scores] = ocsvm(adultdata, ...
    StandardizeData=true,KernelScale="auto");
Plot a histogram of the score values. Create a vertical line at the default score threshold.
h = histogram(scores,NumBins=50,Normalization="probability");
h.Parent.YScale = 'log';
xline(Mdl.ScoreThreshold,"r-",join(["Threshold" Mdl.ScoreThreshold]))

Find the anomalies in the test data using the trained one-class SVM model. Use a different threshold from the default threshold value obtained when training the model.
First, determine the score threshold by using the isoutlier function.
[~,~,U] = isoutlier(scores)
U =
-0.5342
Specify the value of the ScoreThreshold name-value argument as U. Because you specified StandardizeData as true when you trained Mdl, the isanomaly function standardizes new input data using the means and standard deviations stored in Mdl.Mu and Mdl.Sigma, respectively.
[tf_test,scores_test] = isanomaly(Mdl,adulttest,ScoreThreshold=U);
h = histogram(scores_test,NumBins=50,Normalization="probability");
h.Parent.YScale = 'log';
xline(U,"r-",join(["Threshold" U]))
