tabulate
Frequency table
Description
Examples
Create a frequency table for a vector of data.
Load the patients data set. Display the first five entries of the Gender variable. Each value indicates the gender of a patient.
load patients
Gender(1:5)
ans = 5×1 cell
{'Male' }
{'Male' }
{'Female'}
{'Female'}
{'Female'}
Generate a frequency table that shows the number and percentage of Male and Female patients in the data set.
tabulate(Gender)
   Value    Count   Percent
    Male       47     47.00%
  Female       53     53.00%
Create a frequency table for a vector of positive integers. By default, if a vector x contains only positive integers, then tabulate returns 0 counts for the integers between 1 and max(x) that do not appear in x. To avoid this behavior, convert the vector x to a categorical vector before calling tabulate.
Load the patients data set. Display the first five entries of the Height variable. Each value indicates the height, in inches, of a patient.
load patients
Height(1:5)
ans = 5×1
71
69
64
67
64
Create a frequency table that shows, in its second and third columns, the number and percentage of patients in the data set that have a particular height. Display the first five entries and the last five entries of the matrix that tabulate returns. tbl contains one row for each height between 1 and 72 inches, where 72 is the maximum height value in Height.
tbl = tabulate(Height);
first = tbl(1:5,:)
first = 5×3

     1     0     0
     2     0     0
     3     0     0
     4     0     0
     5     0     0
last = tbl(end-4:end,:)
last = 5×3

    68    15    15
    69     8     8
    70    11    11
    71    10    10
    72     4     4
Generate a frequency table that shows Count and Percent values only for heights that appear in the Height variable. Convert Height to a categorical variable, and then call the tabulate function.
newHeight = categorical(Height);
tabulate(newHeight)
  Value    Count   Percent
     60        1      1.00%
     62        3      3.00%
     63        7      7.00%
     64       12     12.00%
     65        8      8.00%
     66       15     15.00%
     67        6      6.00%
     68       15     15.00%
     69        8      8.00%
     70       11     11.00%
     71       10     10.00%
     72        4      4.00%
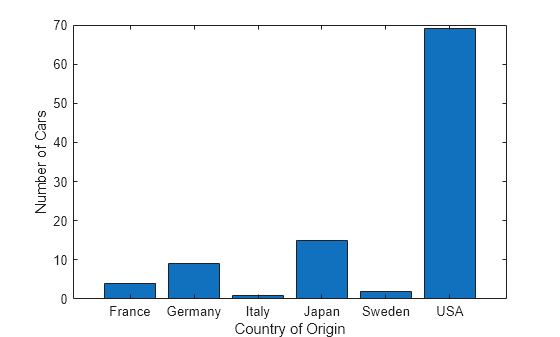
Create a frequency table from a character array by using tabulate. Convert the resulting cell array to a table array, and visualize the results.
Load the carsmall data set. Tabulate the data in the Origin variable, which shows the country of origin of each car in the data set. Convert the resulting cell array tbl to a table array t. Change the Value column to a categorical vector.
load carsmall
tbl = tabulate(Origin);
t = cell2table(tbl,'VariableNames', ...
    {'Value','Count','Percent'});
t.Value = categorical(t.Value)
t=6×3 table
     Value     Count    Percent
    _______    _____    _______

    USA         69        69
    France       4         4
    Japan       15        15
    Germany      9         9
    Sweden       2         2
    Italy        1         1
Create a bar graph from the frequency table.
bar(t.Value,t.Count)
xlabel('Country of Origin')
ylabel('Number of Cars')
Create a frequency table from a numeric vector with NaN values.
Load the carsmall data set. The MPG variable contains the miles per gallon measurement of 100 cars. For six of the cars, the MPG value is missing (NaN).
load carsmall
numcars = length(MPG)
numcars = 100
nanindex = isnan(MPG);
numMissingMPG = length(MPG(nanindex))
numMissingMPG =
6
Create a frequency table using MPG. Convert the matrix output from tabulate to a table, and label the table columns.
tbl = tabulate(MPG);
t = array2table(tbl,'VariableNames', ...
    {'Value','Count','Percent'})
t=37×3 table
    Value    Count    Percent
    _____    _____    _______

       9       1      1.0638
      10       2      2.1277
      11       1      1.0638
      13       4      4.2553
      14       5      5.3191
    14.5       1      1.0638
      15       5      5.3191
    15.5       1      1.0638
      16       2      2.1277
    16.5       2      2.1277
      17       1      1.0638
    17.5       2      2.1277
      18       4      4.2553
    18.5       1      1.0638
      19       2      2.1277
      20       2      2.1277
      ⋮
The frequency table displays data only for the 94 cars with numeric MPG values. tabulate calculates the percentage of each MPG value in this subset of cars, not the entire set of 100 cars.
tnumcars = sum(t.Count)
tnumcars =
94
Input Arguments
Output Arguments
Alternative Functionality
MATLAB® includes the function
groupcounts, which also returns group counts and is recommended when you are working with a table.The
grpstatsfunction also returns group counts plus additional group summary statistics.
Extended Capabilities
Version History
Introduced before R2006a