Explore Signal Decomposition
For all decomposition types, you can use the Wavelet Signal Analyzer app to:
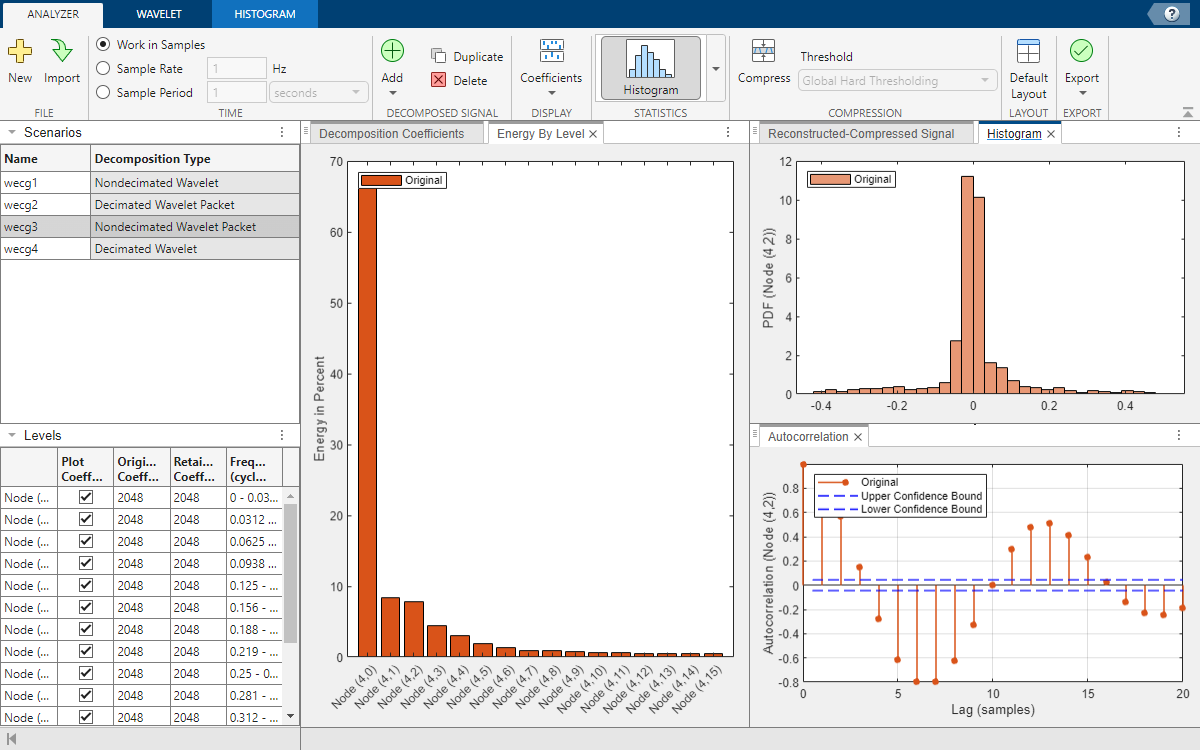
Display the histogram of the wavelet coefficients of a specific decomposition level or terminal node.
Plot the energy of the decomposition levels or terminal nodes.
Plot the autocorrelation of the wavelet coefficients at a specific decomposition level or terminal node.
Furthermore, for nondecimated wavelet decompositions, you can plot the variance estimates of the coefficients, including the confidence intervals. at all decomposition levels.
The plots always reflect the scenario that you have selected.
When analyzing complex-valued data, the app plots the real- and imaginary-parts of the histogram and autocorrelation. For more information, see Wavelet Decomposition of Complex-Valued Signal Using Wavelet Signal Analyzer.
When you enable compression, the plots show statistics for original and compressed signals. For more information, see the next workflow step, Compress Signal.
Explore Histogram
To display the histogram of the scenario that you have selected, on the
Analyzer tab, in the Statistics section,
click the arrow to open the gallery. In the By Level group, click
Histogram. The histogram appears in the
Histogram pane. For a wavelet decomposition, the app initially
displays a histogram of the wavelet coefficients at the first decomposition level. For a
wavelet packet decomposition of level L, the app displays a histogram
of the terminal node (L,0).
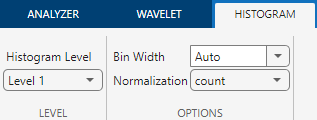
On the Histogram tab, you can:
Select a different level or node from the Histogram Level list.
Specify a bin width in the Bin Width box, or select
Autoto restore the default width.Use the Normalization list to specify either raw counts or to normalize as a probability density function (pdf).
Explore Energy
If you use an orthogonal wavelet with the discrete wavelet transform, you partition the energy of a signal across detail and approximation levels. Similarly, if you use an orthogonal wavelet with the wavelet packet transform, you partition the energy among the equal-width subbands. This is true for both decimated and undecimated wavelet packet transforms.
To plot the energy of a decomposition in a bar graph, first select a decomposition in Scenarios. Then, on the Analyzer tab, in the Statistics section, click the arrow to open the gallery. Under For All Levels, click Energy by Level. The bar graph appears in the Energy By Level pane.
Explore Autocorrelation
To plot the autocorrelation, first select a decomposition in Scenarios. Then, on the Analyzer tab, in the Statistics section, click the arrow to open the gallery. In the By Level group, click Autocorrelation. The autocorrelation appears in the Autocorrelation pane. The plot includes the upper and lower bounds of the 95% confidence interval. For a wavelet decomposition, the app initially displays the autocorrelation of the wavelet coefficients at the first decomposition level. For a wavelet packet decomposition of level L, the app displays the autocorrelation of the terminal node (L,0) coefficients.
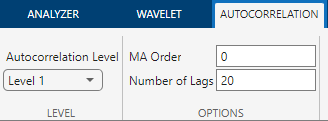
On the Autocorrelation tab, you can:
Select a different level or node from the Autocorrelation Level list.
Change the order of the moving average filter in the MA Order box.
Change the number of lags in the Number of Lags box.
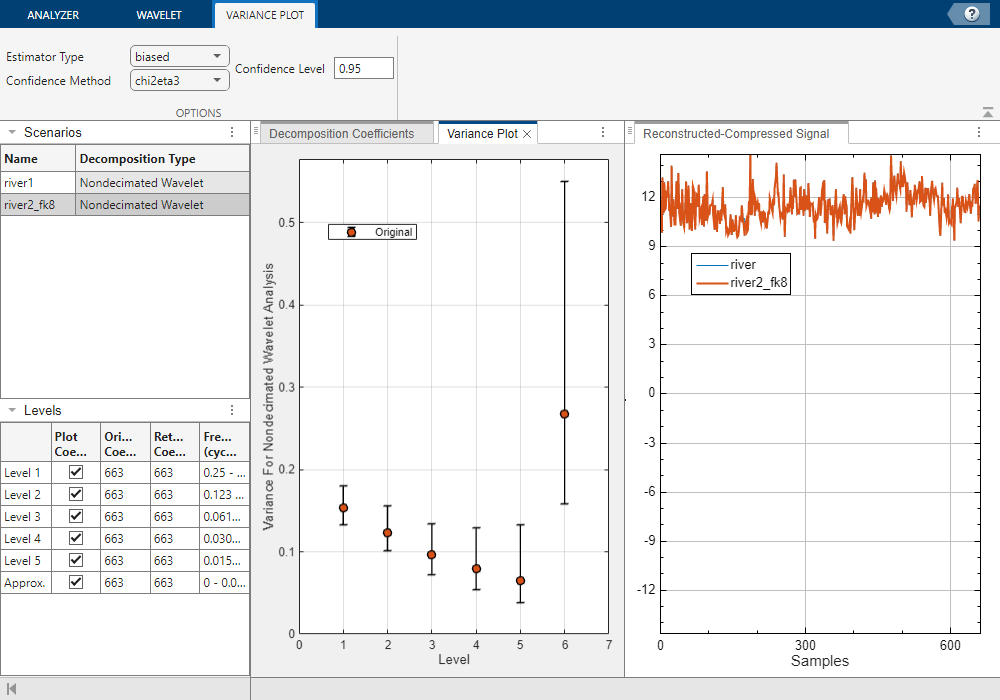
Explore Variance
The nondecimated discrete wavelet transform partitions the data variance by scale. (For an illustration, see Wavelet Analysis of Financial Data.) You can use Wavelet Signal Analyzer to visualize the variance estimates of the coefficients in a nondecimated wavelet decomposition.
To plot the variances, select a nondecimated wavelet decomposition in Scenarios. In the Statistics section of the Analyzer tab, click the arrow to open the gallery. In the For All Levels group, click Variance Plot. By default, the app plots the unbiased estimates of the wavelet variances in the Variance Plot pane. The plot includes the 95% confidence intervals.
You can change how the app obtains the variances. On the Variance Plot tab, you can:
Select a biased or unbiased estimator from the Estimator Type list. For more information, see
EstimatorTypeinmodwtvar.Choose a chi-square or Gaussian distribution from the Confidence Method list (see
ConfidenceMethod).Specify the confidence level in the Confidence Level box (see
conflevel).
The plot updates immediately after you change a setting.
Note
For complex-valued signals, the app computes the variances of the real and imaginary parts of the decomposition coefficients separately. For more information, see Wavelet Decomposition of Complex-Valued Signal Using Wavelet Signal Analyzer.
Workflow
| Previous Step | Current Step | Next Step |
|---|---|---|
| Decompose Signal | Explore and Measure Signal Decomposition | Compress Signal |