Results for
これからは生成AIでコードを1から書くという事が減ってくるのかと思いますが,皆さんがMATLABのコードを書く時に意識しているご自身のルールのようなものがあれば教えてください.
MATLAB言語は柔軟に書けますが,自然と個人個人のルールというものが出来上がってきているのでは,と思います.
私はParameter, Valueペアの引数がある関数はそれぞれのペアを新しい行に書く,というのをよくやります.
h = plot(x, y, "ro-", ...
"LineWidth", 2, ...
"MarkerSize", 10, ...
"MarkerFaceColor", "g");
Parameter=Valueでも同じです.
h = plot(x, y, "ro-", ...
LineWidth = 2, ...
MarkerSize = 10, ...
MarkerFaceColor = "g");
また,一時期は "=" を揃えることもやってました(今はやってませんが).
h = plot(x, y, "ro-", ...
LineWidth = 2, ...
MarkerSize = 10, ...
MarkerFaceColor = "g");
皆さんにはどのようなルールがありますか?
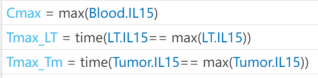
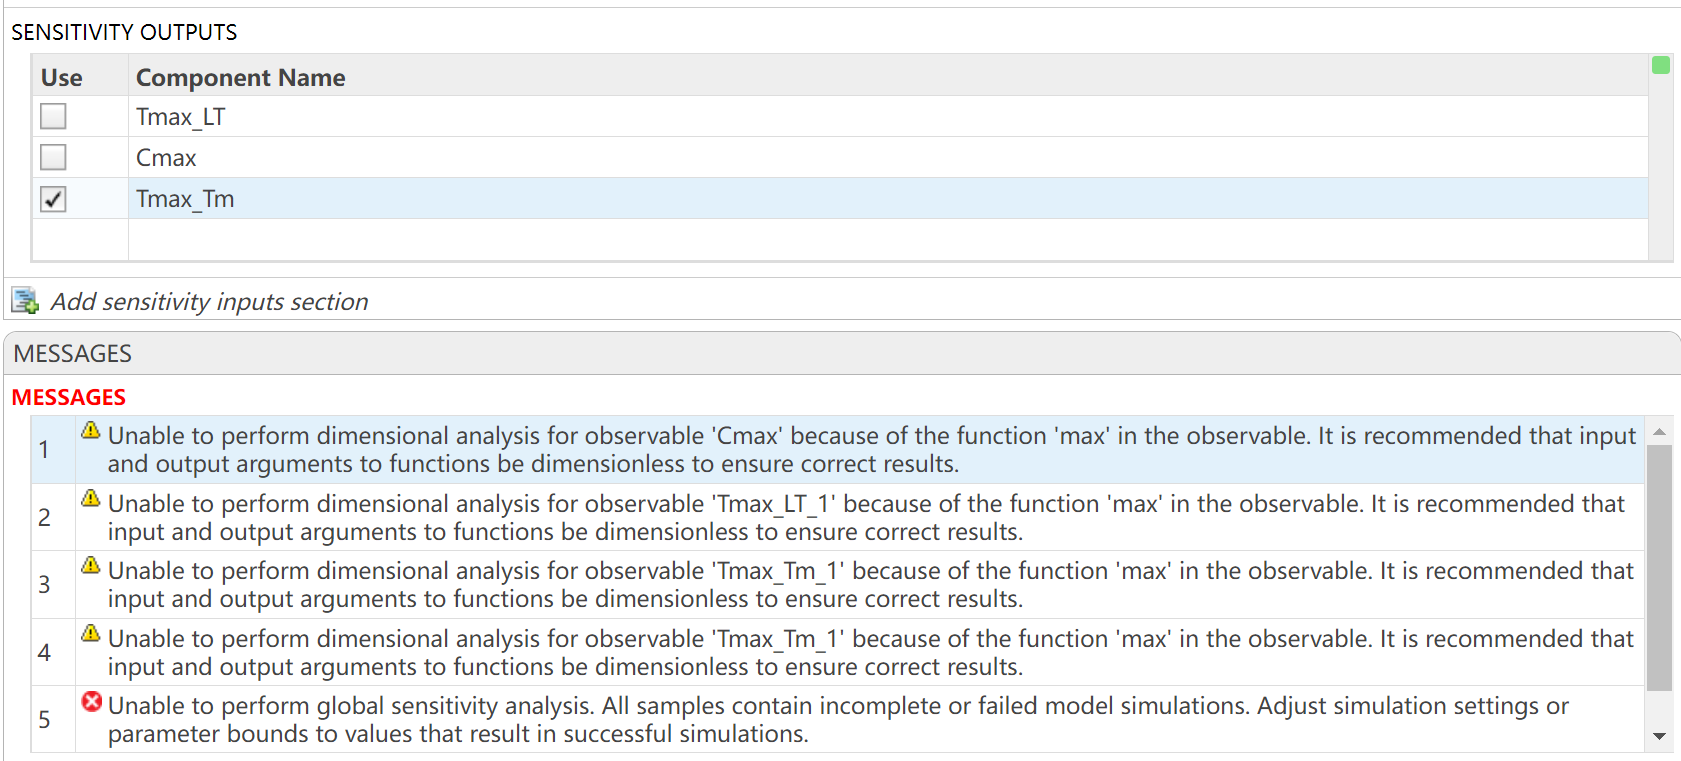
I want to observe the time (Tmax) to reach maximum drug concentration (Cmax) in my model. I have set up the OBSERVABLES as follows (figure1): Cmax = max(Blood.lL15); Tmax_LT = time(Conc_lL15_LT_nm == max(Conc_lL15_LT_nm)); Tmax_Tm = time(Conc_lL15_Tumor_nm == max(Conc_lL15_Tumor_nm)); After running the Sobol indices program for global sensitivity analysis, with inputs being some parameters and their ranges, the output for Cmax works, but there are some prompts, as shown in figure2. Additionally, when outputting Tmax, the program does not run successfully and reports some errors, as shown in figure2. How can I resolve the errors when outputting Tmax?
昨日 5/29 にお台場で MATLAB EXPO が開催されました。ご参加くださった方々ありがとうございました!
私は AI 関連のデモ展示で解説員としても立っておりましたが、立ち寄ってくださる方が絶えず、ずっと喋り続けてました。また、講演後に「さっきのすごくね?」という会話が漏れ聞こえてきたのがハイライト。
参加されたみなさま、印象に残ったこと・気になった講演・ポスター・デモ・新機能等あったら教えてください!(次回に向けて運営面での感想も)
以前のEXPOでも参加・聴講したことがある
67%
知り合いから聞いた
0%
MathWorksからのプロモーション,EXPOサイトで知った
0%
今年のEXPO会場でたまたま見かけた
0%
ライトニングトークって何?
33%
3 votes
Large Languge model with MATLAB, a free add-on that lets you access LLMs from OpenAI, Azure, amd Ollama (to use local models) on MATLAB, has been updated to support OpenAI GPT-4.1, GPT-4.1 mini, and GPT-4.1 nano.
According to OpenAI, "These models outperform GPT‑4o and GPT‑4o mini across the board, with major gains in coding and instruction following. They also have larger context windows—supporting up to 1 million tokens of context—and are able to better use that context with improved long-context comprehension."
What would you build with the latest update?

Provide insightful answers
9%
Provide label-AI answer
9%
Provide answer by both AI and human
21%
Do not use AI for answers
46%
Give a button "chat with copilot"
10%
use AI to draft better qustions
5%
1561 votes
%% 清理环境
close all; clear; clc;
%% 模拟时间序列
t = linspace(0,12,200); % 时间从 0 到 12,分 200 个点
% 下面构造一些模拟的"峰状"数据,用于演示
% 你可以根据需要替换成自己的真实数据
rng(0); % 固定随机种子,方便复现
baseIntensity = -20; % 强度基线(z 轴的最低值)
numSamples = 5; % 样本数量
yOffsets = linspace(20,140,numSamples); % 不同样本在 y 轴上的偏移
colors = [ ...
0.8 0.2 0.2; % 红
0.2 0.8 0.2; % 绿
0.2 0.2 0.8; % 蓝
0.9 0.7 0.2; % 金黄
0.6 0.4 0.7]; % 紫
% 构造一些带多个峰的模拟数据
dataMatrix = zeros(numSamples, length(t));
for i = 1:numSamples
% 随机峰参数
peakPositions = randperm(length(t),3); % 三个峰位置
intensities = zeros(size(t));
for pk = 1:3
center = peakPositions(pk);
width = 10 + 10*rand; % 峰宽
height = 100 + 50*rand; % 峰高
% 高斯峰
intensities = intensities + height*exp(-((1:length(t))-center).^2/(2*width^2));
end
% 再加一些小随机扰动
intensities = intensities + 10*randn(size(t));
dataMatrix(i,:) = intensities;
end
%% 开始绘图
figure('Color','w','Position',[100 100 800 600],'Theme','light');
hold on; box on; grid on;
for i = 1:numSamples
% 构造 fill3 的多边形顶点
xPatch = [t, fliplr(t)];
yPatch = [yOffsets(i)*ones(size(t)), fliplr(yOffsets(i)*ones(size(t)))];
zPatch = [dataMatrix(i,:), baseIntensity*ones(size(t))];
% 使用 fill3 填充面积
hFill = fill3(xPatch, yPatch, zPatch, colors(i,:));
set(hFill,'FaceAlpha',0.8,'EdgeColor','none'); % 调整透明度、去除边框
% 在每条曲线尾部标注 Sample i
text(t(end)+0.3, yOffsets(i), dataMatrix(i,end), ...
['Sample ' num2str(i)], 'FontSize',10, ...
'HorizontalAlignment','left','VerticalAlignment','middle');
end
%% 坐标轴与视角设置
xlim([0 12]);
ylim([0 160]);
zlim([-20 350]);
xlabel('Time (sec)','FontWeight','bold');
ylabel('Frequency (Hz)','FontWeight','bold');
zlabel('Intensity','FontWeight','bold');
% 设置刻度(根据需要微调)
set(gca,'XTick',0:2:12, ...
'YTick',0:40:160, ...
'ZTick',-20:40:200);
% 设置视角(az = 水平旋转,el = 垂直旋转)
view([211 21]);
% 让三维坐标轴在后方
set(gca,'Projection','perspective');
% 如果想去掉默认的坐标轴线,也可以尝试
% set(gca,'BoxStyle','full','LineWidth',1.2);
%% 可选:在后方添加一个浅色网格平面 (示例)
% 这个与题图右上方的网格类似
[Xplane,Yplane] = meshgrid([0 12],[0 160]);
Zplane = baseIntensity*ones(size(Xplane)); % 在 Z = -20 处画一个竖直面的框
surf(Xplane, Yplane, Zplane, ...
'FaceColor',[0.95 0.95 0.9], ...
'EdgeColor','k','FaceAlpha',0.3);
%% 进一步美化(可根据需求调整)
title('3D Stacked Plot Example','FontSize',12);
constantplane("x",12,FaceColor=rand(1,3),FaceAlpha=0.5);
constantplane("y",0,FaceColor=rand(1,3),FaceAlpha=0.5);
constantplane("z",-19,FaceColor=rand(1,3),FaceAlpha=0.5);
hold off;

Have fun! Enjoy yourself!
We are excited to announce the first edition of the MathWorks AI Challenge. You’re invited to submit innovative solutions to challenges in the field of artificial intelligence. Choose a project from our curated list and submit your solution for a chance to win up to $1,000 (USD). Showcase your creativity and contribute to the advancement of AI technology.
Simulink has been an essential tool for modeling and simulating dynamic systems in MATLAB. With the continuous advancements in AI, automation, and real-time simulation, I’m curious about what the future holds for Simulink.
What improvements or new features do you think Simulink will have in the coming years? Will AI-driven modeling, cloud-based simulation, or improved hardware integration shape the next generation of Simulink?
You've probably heard about the DeepSeek AI models by now. Did you know you can run them on your own machine (assuming its powerful enough) and interact with them on MATLAB?
In my latest blog post, I install and run one of the smaller models and start playing with it using MATLAB.
Larger models wouldn't be any different to use assuming you have a big enough machine...and for the largest models you'll need a HUGE machine!
Even tiny models, like the 1.5 billion parameter one I demonstrate in the blog post, can be used to demonstrate and teach things about LLM-based technologies.
Have a play. Let me know what you think.
私の場合、前の会社が音楽認識アプリの会社で、アルゴリズム開発でFFTが使われていたことがきっかけでした。でも、MATLABのすごさが分かったのは、機械学習のオンライン講座で、Andrew Ngが、線型代数を使うと、数式と非常に近い構文のコードで問題が処理できることを学んだ時でした。
Toolbox 全部入りの MATLAB ライセンス
67%
まだ持っていない Toolbox (下記にコメントください)
0%
MATLAB T シャツ
17%
MATLAB ルービックキューブ
0%
MATLAB 靴下
6%
MathWorks オフィス訪問チケット
11%
18 votes
この場は MATLAB や Simulink を使っている皆さんが、気軽に質問や情報交換ができる場所として作られました。日本語でも気軽に投稿ができるように今回日本語チャネルを解説します。
ユーザーの皆様とのやり取りを通じて、みんなで知識や経験を共有し、一緒にスキルアップしていきましょう。 どうぞお気軽にご参加ください。
そして日本語チャネル開設にあたってコメントくださった皆様、ありがとうございます!
Is it possible to differenciate the input, output and in-between wires by colors?
I was curious to startup your new AI Chat playground.
The first screen that popped up made the statement:
"Please keep in mind that AI sometimes writes code and text that seems accurate, but isnt"
Can someone elaborate on what exactly this means with respect to your AI Chat playground integration with the Matlab tools?
Are there any accuracy metrics for this integration?
Watch episodes 5-7 for the new stuff, but the whole series is really great.
初カキコ…ども… 俺みたいな中年で深夜にMATLAB見てる腐れ野郎、 他に、いますかっていねーか、はは
今日のSNSの会話 あの流行りの曲かっこいい とか あの 服ほしい とか ま、それが普通ですわな
かたや俺は電子の砂漠でfor文無くして、呟くんすわ
it'a true wolrd.狂ってる?それ、誉め 言葉ね。
好きなtoolbox Signal Processing Toolbox
尊敬する人間 Answersの海外ニキ(学校の課題質問はNO)
なんつってる間に4時っすよ(笑) あ~あ、休日の辛いとこね、これ
-----------
ディスカッションに記事を書いたら謎の力によって消えたっぽいので、性懲りもなくだらだら書いていこうと思います。前書いた内容忘れたからテキトーに書きます。
救いたいんですよ、Centralを(倒置法)
いっぬはMATLAB Answersに育てられてキャリアを積んできたんですよ。暇な時間を見つけてはAnswersで回答して承認欲求を満たしてきたんです。わかんない質問に対しては別の人が回答したのを学び、応用してバッジもらったりしちゃったりしてね。
そんな思い出の大事な1ピースを担うMATLAB Centralが、いま、苦境に立たされている。僕はMATLAB Centralを救いたい。
最悪、救うことが出来なくともCentralと一緒に死にたい。Centralがコミュニティを閉じるのに合わせて、僕の人生の幕も閉じたい。MATLABメンヘラと呼ばれても構わない。MATLABメンヘラこそ、MATLABに対する愛の証なのだ。MATLABメンヘラと呼ばれても、僕は強く生きる。むしろ、誇りに思うだろう。
こうしてMATLABメンヘラへの思いの丈を精一杯綴った今、僕はこう思う。
MATLABメンヘラって何?
なぜ苦境に立っているのか?
生成AIである。Hernia Babyは激怒した。必ず、かの「もうこれでいいじゃん」の王を除かなければならぬと決意した。Hernia BabyにはAIの仕組みがわからぬ。Hernia Babyは、会社の犬畜生である。マネージャが笛を吹き、エナドリと遊んで暮して来た。けれどもネットmemeに対しては、人一倍に敏感であった。
風の噂によるとMATLAB Answersの質問数も微妙に減少傾向にあるそうな。
確かにTwitter(現X)でもAnswers botの呟き減ったような…。
ゆ、許せんぞ生成AI…!
MATLAB Centralは日本では流行ってない?
そもそもCentralって日本じゃあまりアクセスされてないんじゃなイカ?
だってどうやってここにたどり着けばいいかわかんねえもん!(暴言)
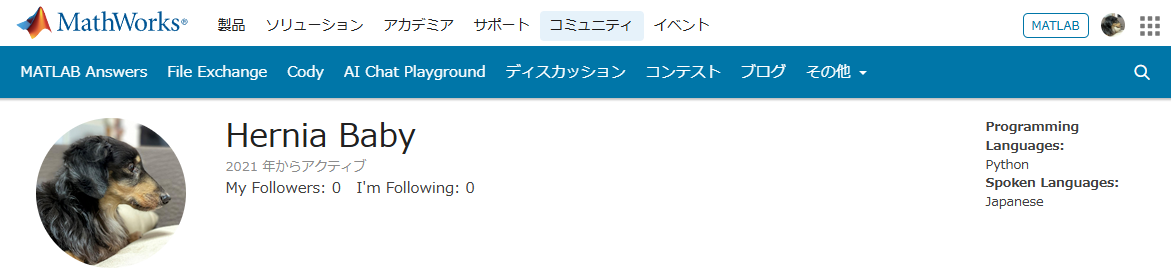
MATLABのHPにはないから一回コミュニティのプロファイル入って…
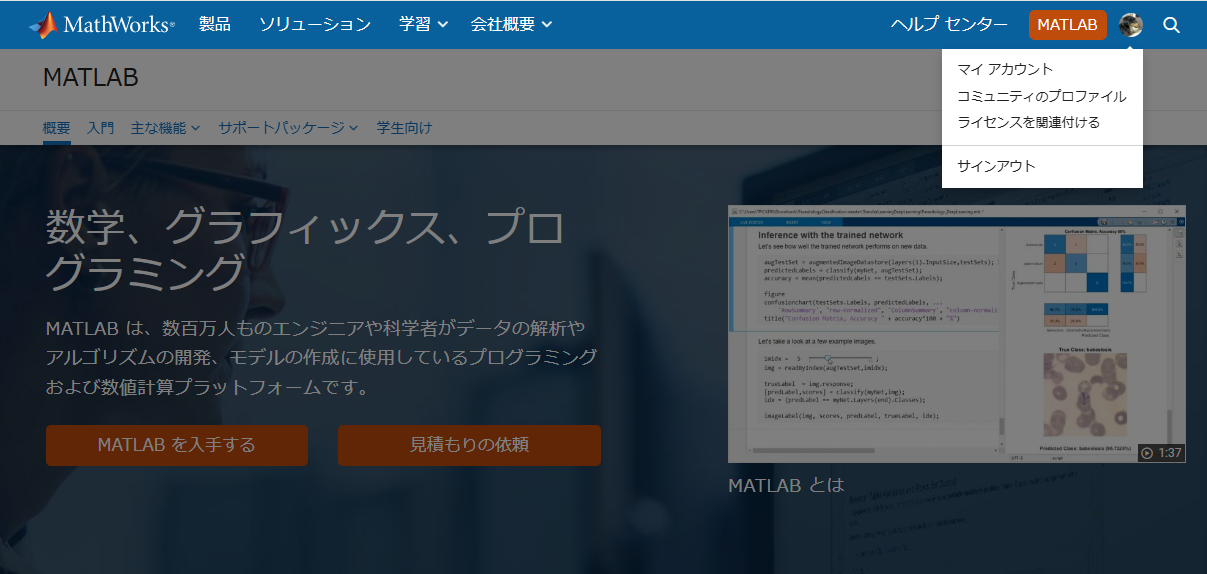
やっと表示される。気づかんって!
MATLAB Centralは無料で学べる宝物庫
とはいえ本当にオススメなんです。
どんなのがあるかさらっと紹介していきます。
ここは短い文章で問題を解くコードを書き上げるところ。
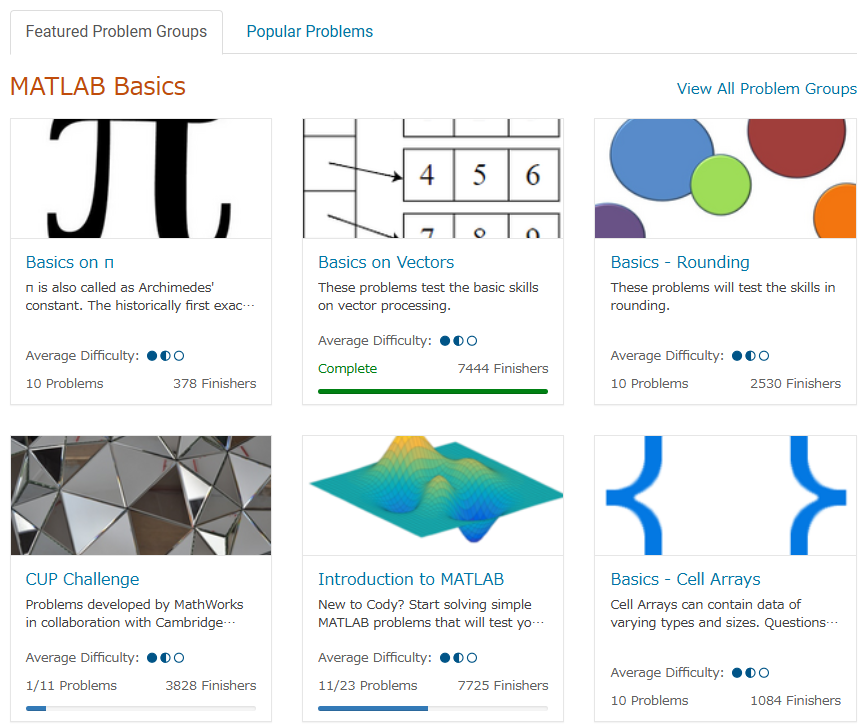
多様な分野を実践的に学ぶことができるし、何より他人のコードも見ることができる。
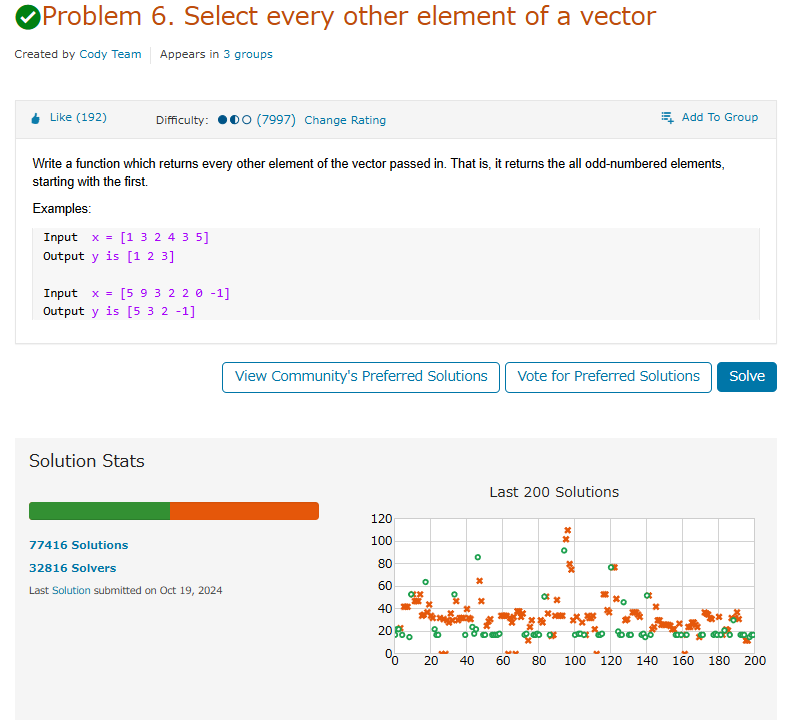
たまにそんなのありかよ~って回答もあるけどいい訓練になる。
ただ英語の問題見たらさ~ 悪い やっぱつれぇわ…
我らがアイドルmichioニキやJiro氏が新機能について紹介なんかもしてくれてる。
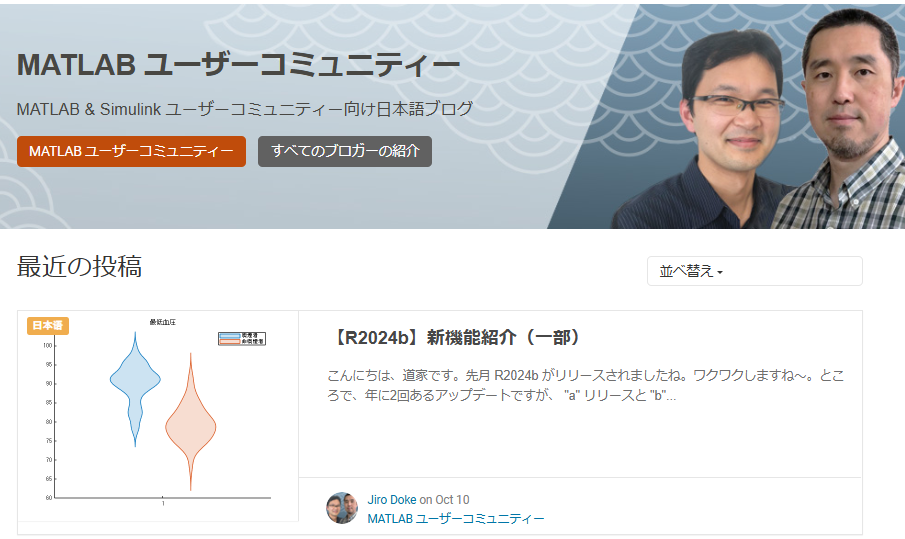
なんだかんだTwitter(現X)で紹介しちゃってるから、見るのさぼったり…ゲフンゲフン!
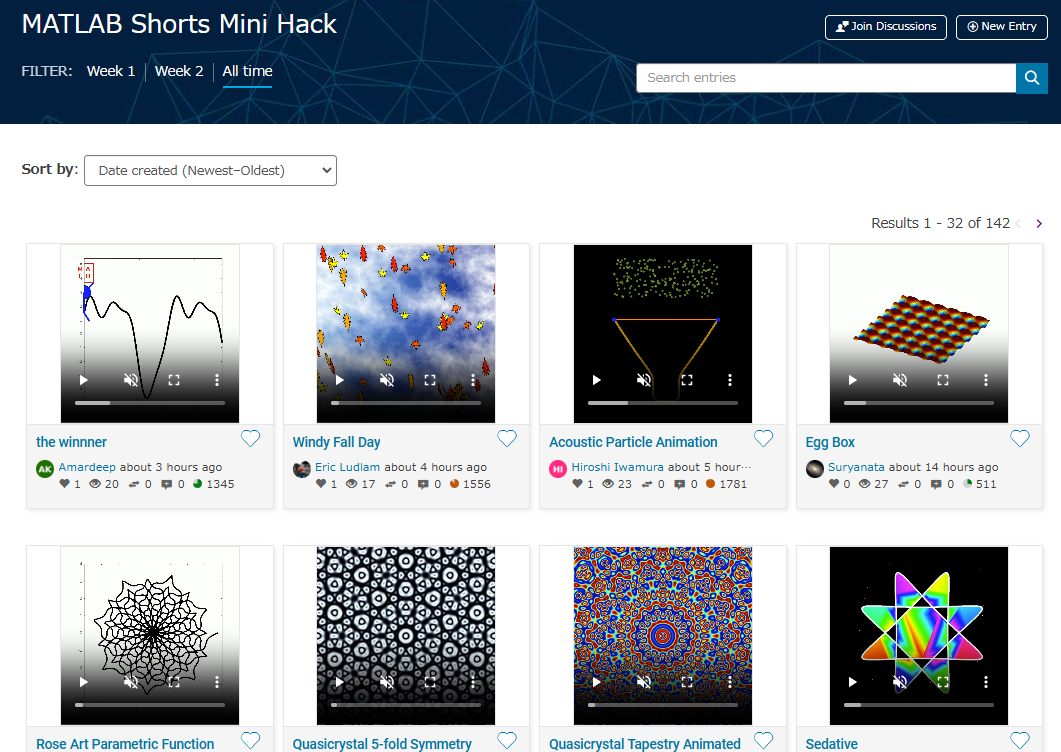
定期的に開催される。
プライズも貰えたりするし、何よりめっちゃ面白い作品を皆が書いてくる。
p=pi;
l = 5e3;
m = 0:l;
[u,v]=meshgrid(10*m/l*p,2*m/l*p);
c=cos(v/2);
s=sin(v);
e=1-exp(u/(6*p));
surf(2*e.*cos(u).*c.^2,-e*2.*sin(u).*c.^2,1-exp(u/(3.75*p))-s+exp(u/(5.5*p)).*s,'FaceColor','#a47a43','EdgeAlpha',0.02)
axis equal off
A=7.3;
zlim([-A 0])
view([-12 23])
set(gcf,'Color','#d2b071')

過去の事は水に流してくれないか?
toolboxにない自作関数とかを無料で皆が公開してるところ。
MATLABのアドオンからだと関数をそのままインストール出来たりする。
だいたいの答えはここにある。質問する前にググれば出てくる。
躓いて調べると過去に書いてあった自分の回答に助けられたりもする。
for文で回答すると一定数の海外ニキたちが
と絡んでくる。
Answersがバキバキ回答する場であるのに対して、ここでは好きなことを呟いていいらしい。最近できたっぽい。全然知らんかった。海外では「こんな機能欲しくね?」とかけっこう人気っぽい。
日本人が書いてないから僕がこんなクソスレ書いてるわけ┐(´д`)┌ヤレヤレ
まとめ
いかがだったでしょうか?このようにCentralは学びとして非常に有効な場所なのであります。インプットもいいけど是非アウトプットしてみましょう。コミュニティはアカウントさえ持ってたら無料でやれるんでね。
皆はどうやってMATLAB/Simulinkを学んだか、良ければ返信でクソレスしてくれると嬉しいです。特にSimulinkはマジでな~んにもわからん。MathWorksさんode45とかソルバーの説明ここでしてくれ。
後、ディスカッション一時保存機能つけてほしい。
最後に
Centralより先に、俺を救え
参考:ミスタードーナツを救え
Local large language models (LLMs), such as llama, phi3, and mistral, are now available in the Large Language Models (LLMs) with MATLAB repository through Ollama™!
Read about it here:
Hi All,
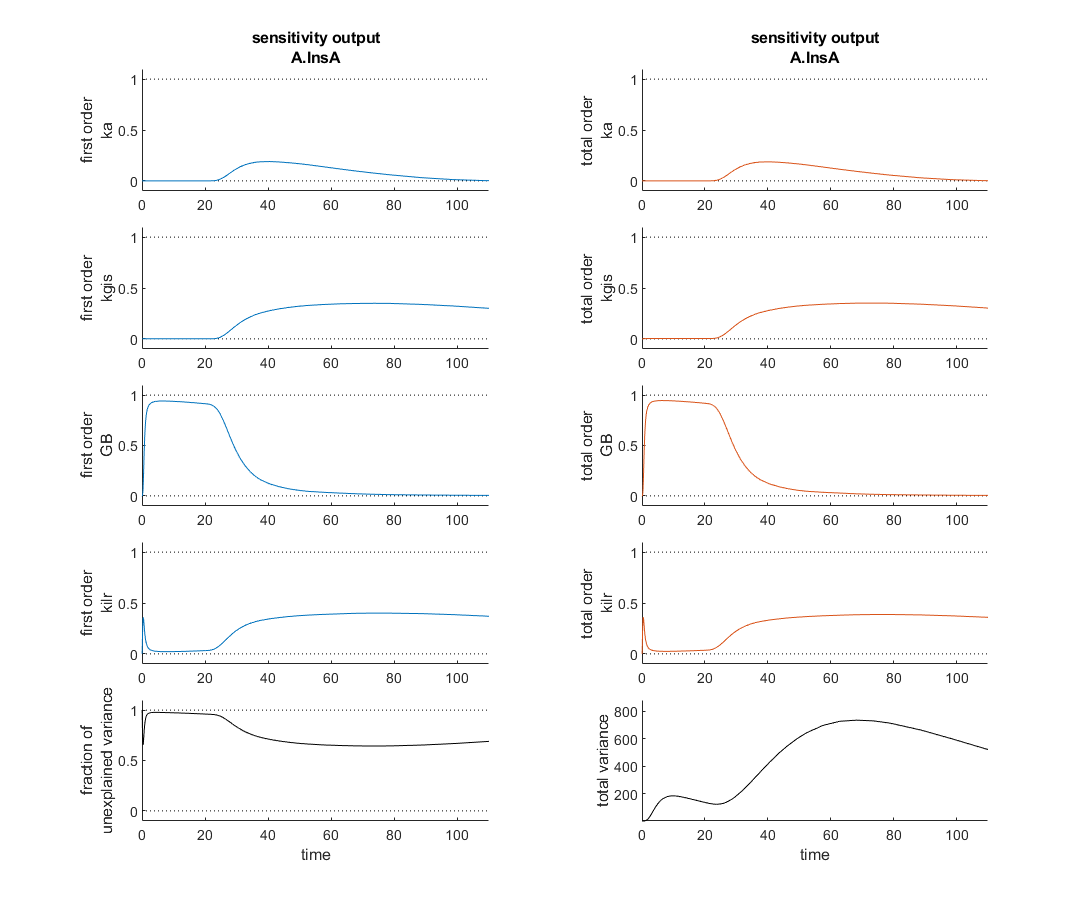
I'm currently verifying a global sensitivity analysis done in SimBiology and I'm a touch confused. This analysis was run with every parameter and compartment volume in the model. To my understanding the fraction of unexplained variance is 1 - the sum of the first order variances, therefore if the model dynamics are dominated by interparameter effects you might see a higher fraction of unexplained variance. In this analysis however, as the attached figure shows (with input at t=20 minutes), the most sensitive four parameters seem to sum, in first order sensitivities to roughly one at each time point and the total order sensitivies appear nearly identical. So how is the fraction of unexplained variance near one?
Thank you for your help!