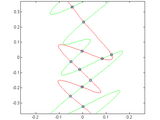
Fast computation of intersections and self-intersections of curves using vectorization.
- 30.7K (All time)
- 19 (Last 30 days)
- 4.7 / 5
- Community
-
24 Sep 2010

- 13K (All time)
- 19 (Last 30 days)
- 5.0 / 5
- Community
-
16 Aug 2012

num2strexact (exact version of num2str)
num2strexact does exact conversion of number to string based on IEEE floating point bit pattern
- 3.1K (All time)
- 1 (Last 30 days)
- 5.0 / 5
- Community
-
11 Jun 2020

- 44.6K (All time)
- 18 (Last 30 days)
- 4.9 / 5
- Community
-
31 May 2024

- 108.6K (All time)
- 256 (Last 30 days)
- 4.8 / 5
- Community
-
1 Sep 2016

Randomly and uniformly generates vectors with a specified sum and values in a specified interval.
- 10.3K (All time)
- 5 (Last 30 days)
- 5.0 / 5
- Community
-
24 Jan 2006

MAT2TILES: divide array into equal-sized sub-arrays
Splits an array of any dimension into cell array of equal sized chunks.
- 3.5K (All time)
- 4 (Last 30 days)
- 4.6 / 5
- Community
-
24 Sep 2017

tight_subplot(Nh, Nw, gap, marg_h, marg_w)
Fills the figure with axes subplots with easily adjustable margins and gaps between the axes.
- 56.6K (All time)
- 67 (Last 30 days)
- 4.7 / 5
- Community
-
3 Mar 2016

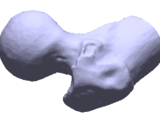
inpolyhedron - are points inside a triangulated volume?
Test if 3d points are inside a mesh. Or, voxelise a mask from a surface. Mesh can be non-convex too!
- 8.9K (All time)
- 62 (Last 30 days)
- 4.8 / 5
- Community
-
12 Nov 2015

- 23.3K (All time)
- 72 (Last 30 days)
- 5.0 / 5
- Community
-
9 Oct 2009

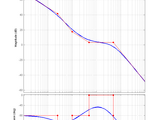
The Graph Digitizer Tool is a MATLAB script that enables users to extract data points from graphs in images.
- 2.5K (All time)
- 92 (Last 30 days)
- 5.0 / 5
- Community
-
13 Nov 2024

- 25.5K (All time)
- 9 (Last 30 days)
- 5.0 / 5
- Community
-
30 Apr 2018
Shapiro-Wilk and Shapiro-Francia normality tests.
Shapiro-Wilk & Shapiro-Francia parametric hypothesis test of composite normality.
- 33.6K (All time)
- 170 (Last 30 days)
- 4.9 / 5
- Community
-
18 Jun 2014
- 25.6K (All time)
- 96 (Last 30 days)
- 4.9 / 5
- Community
-
3 Nov 2015
Benjamini & Hochberg/Yekutieli false discovery rate control procedure for a set of statistical tests
- 13.9K (All time)
- 74 (Last 30 days)
- 4.9 / 5
- Community
-
19 Dec 2015

- 15.4K (All time)
- 9 (Last 30 days)
- 4.9 / 5
- Community
-
5 Dec 2018
Separable Block-wise Operations
Efficiently performs separable operations (e.g., sum, mean,prod, min, max,...) on array sub-blocks
- 1.5K (All time)
- 1 (Last 30 days)
- 5.0 / 5
- Community
-
29 Mar 2019

stlwrite - write ASCII or Binary STL files
Export a variety of inputs (patch, surface) to an STL triangular mesh
- 30.5K (All time)
- 28 (Last 30 days)
- 4.9 / 5
- Community
-
4 May 2018

- 4K (All time)
- 5 (Last 30 days)
- 3.7 / 5
- Community
-
1 Sep 2016
- 29K (All time)
- 102 (Last 30 days)
- 4.7 / 5
- Community
-
22 Sep 2020
- 6.7K (All time)
- 3 (Last 30 days)
- 5.0 / 5
- Community
-
4 Apr 2021

- 2.7K (All time)
- 1 (Last 30 days)
- 5.0 / 5
- Community
-
28 Feb 2019
filefun: Apply a function to files
Adds multi-file functionality to functions handling only single files.
- 3.7K (All time)
- 2 (Last 30 days)
- 5.0 / 5
- Community
-
16 Feb 2007
- 2K (All time)
- 2 (Last 30 days)
- 3.5 / 5
- Community
-
7 Feb 2003
Hungarian Algorithm for Linear Assignment Problems (V2.3)
An extremely fast implementation of the Hungarian algorithm on a native Matlab code.
- 19.9K (All time)
- 15 (Last 30 days)
- 4.5 / 5
- Community
-
15 Sep 2011
Efficient nonlinear regression fitting using a constrained, partitioned least squares overlay to fmi
- 7.8K (All time)
- 2 (Last 30 days)
- 4.5 / 5
- Community
-
23 Jun 2008

- 32.9K (All time)
- 124 (Last 30 days)
- 4.2 / 5
- Community
-
21 Nov 2018
- 45.1K (All time)
- 21 (Last 30 days)
- 4.9 / 5
- Community
-
15 May 2012
- 40.4K (All time)
- 28 (Last 30 days)
- 4.7 / 5
- Community
-
20 Jul 2011

- 6.9K (All time)
- 2 (Last 30 days)
- 4.9 / 5
- Community
-
11 Feb 2019
setFigTransparency - set figure transparency / fading
setFigTransparency sets the transparency/opacity of a figure window, with optional fading effect
- 1.5K (All time)
- 1 (Last 30 days)
- 5.0 / 5
- Community
-
13 Oct 2011
- 3.3K (All time)
- 1 (Last 30 days)
- 5.0 / 5
- Community
-
24 Jul 2002
- 530 (All time)
- 1 (Last 30 days)
- 5.0 / 5
- Community
-
10 Jun 2010
- 30.6K (All time)
- 9 (Last 30 days)
- 5.0 / 5
- Community
-
22 Jan 2011

- 7.1K (All time)
- 11 (Last 30 days)
- 4.7 / 5
- Community
-
31 Oct 2012


getundoc - get undocumented object properties
GETUNDOC returns a structure of undocumented properties (names & values) for the specified object
- 2.8K (All time)
- 1 (Last 30 days)
- 5.0 / 5
- Community
-
10 Mar 2016
- 1.7K (All time)
- 1 (Last 30 days)
- 5.0 / 5
- Community
-
7 Apr 2010

- 16.8K (All time)
- 7 (Last 30 days)
- 5.0 / 5
- Community
-
12 Nov 2008
- 6.2K (All time)
- 3 (Last 30 days)
- 4.9 / 5
- Community
-
11 Mar 2018
- 17.7K (All time)
- 1 (Last 30 days)
- 4.9 / 5
- Community
-
21 Mar 2006

- 2.3K (All time)
- 1 (Last 30 days)
- 5.0 / 5
- Community
-
22 Nov 2010

Intuitive RGB color values from XKCD
RGB triplets for 949 colors, by how they're perceived on a computer monitor and their common names.
- 4.9K (All time)
- 7 (Last 30 days)
- 4.9 / 5
- Community
-
12 Jun 2017

- 2.1K (All time)
- 6 (Last 30 days)
- 5.0 / 5
- Community
-
14 May 2020

- 7.1K (All time)
- 2 (Last 30 days)
- 4.8 / 5
- Community
-
16 Aug 2012

- 19.2K (All time)
- 4 (Last 30 days)
- 4.9 / 5
- Community
-
10 Jan 2019
POLYPARCI calculates confidence intervals for parameters estimated by ‘polyfit’.
- 4.1K (All time)
- 7 (Last 30 days)
- 4.8 / 5
- Community
-
4 Jan 2024

Figure to play and analyze videos with custom plots on top
A figure ready to scroll through and play videos. You can also draw any custom graphics on it.
- 3.4K (All time)
- 4 (Last 30 days)
- 5.0 / 5
- Community
-
12 Dec 2010

Get sheet names from Excel file
Reads the sheet names from Excel file for the given format :: .xls, .xlsm, .xlsx, .xltm, .xltx, .xltm
- 584 (All time)
- 1 (Last 30 days)
- 5.0 / 5
- Community
-
13 Apr 2020

- 17.9K (All time)
- 16 (Last 30 days)
- 5.0 / 5
- Community
-
25 Aug 2025

- 36.8K (All time)
- 3 (Last 30 days)
- 4.8 / 5
- Community
-
6 Mar 2013

- 21.4K (All time)
- 14 (Last 30 days)
- 4.8 / 5
- Community
-
24 May 2018

A solution to the problem of Matlab consuming an enormous amount of time to recover from an "Undefined function or variable" error.
- 384 (All time)
- 2 (Last 30 days)
- 5.0 / 5
- Community
-
17 Mar 2021
- 26.5K (All time)
- 29 (Last 30 days)
- 4.6 / 5
- Community
-
24 Feb 2004
- 4.5K (All time)
- 2 (Last 30 days)
- 5.0 / 5
- Community
-
1 Aug 2020
- 2.6K (All time)
- 2 (Last 30 days)
- 4.8 / 5
- Community
-
1 Sep 2016

- 4.4K (All time)
- 3 (Last 30 days)
- 4.8 / 5
- Community
-
1 Dec 2014

- 102.2K (All time)
- 26 (Last 30 days)
- 4.7 / 5
- Community
-
3 May 2023

- 17.2K (All time)
- 15 (Last 30 days)
- 4.9 / 5
- Community
-
20 Jun 2020
- 5.9K (All time)
- 1 (Last 30 days)
- 4.3 / 5
- Community
-
1 Sep 2016