Main Content

cluster

Validate clusters in phylogenetic tree

    Description

    LeafClusters = cluster(Tree,Threshold) returns a column vector containing a cluster index for each species (leaf) in a phylogenetic tree object. It determines the optimal number of clusters as follows:

    • Starting with two clusters (k = 2), selects the partition that optimizes the criterion specified by the Criterion argument.

    • Increments k by 1 and again selects the optimal partition

    • Continues incrementing k and selecting the optimal partition until a criterion value = Threshold or k = the maximum number of clusters (that is, number of leaves)

    • From all possible k values, selects the k value whose partition optimizes the criterion

    [LeafClusters,NodeClusters] = cluster(Tree,Threshold) returns a column vector containing the cluster index for each leaf node and branch node in Tree.

    [LeafClusters,NodeClusters,Branches] = cluster(Tree,Threshold) returns a two-column matrix containing, for each step in the algorithm, the index of the branch being considered and the value of the criterion. Each row corresponds to a step in the algorithm. The first column contains branch indices, and the second column contains criterion values.

    ___ = cluster(___,Name=Value) ) specifies options using one or more name-value arguments in addition to the input arguments in previous syntaxes. For example, use MaxClust to specify the maximum number of possible clusters for the tested partitions.

    example

    Examples

    collapse all

    Read sequences from a multiple alignment file into a MATLAB structure.

    gagaa = multialignread("aagag.aln");

    Build a phylogenetic tree from the sequences.

    gag_tree = seqneighjoin(seqpdist(gagaa),equivar=gagaa);

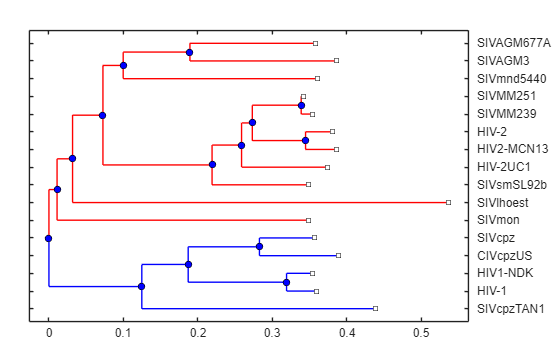
    Validate the clusters in the tree and find the best partition using the gain criterion.

    [i,j] = cluster(gag_tree,[],Criterion="gain",Maxclust=10);

    Use the returned vector of indices to color the branches of each cluster in a plot of the tree.

    h = plot(gag_tree);
    set(h.BranchLines(j==2),Color="b")
    set(h.BranchLines(j==1),Color="r")

    Figure contains an axes object. The axes object contains 49 objects of type line, text. One or more of the lines displays its values using only markers

    Input Arguments

    collapse all

    Phylogenetic tree, specified as a phytree object.

    Threshold value, specified as a number.

    Data Types: double

    Name-Value Arguments

    collapse all

    Specify optional pairs of arguments as Name1=Value1,...,NameN=ValueN, where Name is the argument name and Value is the corresponding value. Name-value arguments must appear after other arguments, but the order of the pairs does not matter.

    Example: [i,j] = cluster(gag_tree,[],Criterion="gain",Maxclust=10)

    Criterion to determine the number of clusters as a function of the species pairwise distances, specified as one of these values:

    • "maximum" — Maximum within cluster pairwise distance, Wmax. Cluster splitting stops when WmaxThreshold.

    • "median" — Median within cluster pairwise distance, Wmed. Cluster splitting stops when WmedThreshold.

    • "average" — Average within cluster pairwise distance, Wavg. Cluster splitting stops when WavgThreshold.

    • "ratio" — Between/within cluster pairwise distance ratio, defined as

      BWrat = (trace(B)/(k - 1)) / (trace(W)/(n - k))

      where B and W are the between- and within-scatter matrices, respectively. k is the number of clusters, and n is the number of species in the tree. Cluster splitting stops when BWratThreshold.

    • "gain" — Within cluster pairwise distance gain, defined as

      Wgain = (trace(Wold)/ (trace(W) - 1) * (n - k - 1))

      where W and Wold are the within-scatter matrices for k and k - 1, respectively. k is the number of clusters, and n is the number of species in the tree. Cluster splitting stops when WgainThreshold.

    • "silhouette" — Average silhouette width, SWavg. The value ranges from -1 to +1. Cluster splitting stops when SWavgThreshold. For more information, see silhouette.

    Data Types: char | string

    Maximum number of possible clusters for the tested partitions, specified as a positive integer.

    When using the "maximum", "median", or "average" criteria, set Threshold to [] (empty) to force the cluster function to return MaxClust clusters. It does so because such metrics monotonically decrease as k increases.

    When using the "ratio", "gain", or "silhouette" criteria, it can be difficult to estimate an appropriate Threshold in advance. Set Threshold to [] (empty) to find the optimal number of clusters below the value specified by MaxClust. Also, set MaxClust to a small value to avoid expensive computation due to testing all possible number of clusters.

    Data Types: double

    Biological distances between each pair of sequences, specified as a matrix of pairwise distances, such as a matrix returned by the seqpdist function. The cluster function substitutes this matrix for the patristic distances in Tree. For example, this matrix can contain the real sample pairwise distances.

    Data Types: double

    Output Arguments

    collapse all

    Cluster indices for each species (leaf) in a phylogenetic tree, returned as a column vector.

    Cluster indices for each leaf node and branch node in a phylogenetic tree, returned as a column vector.

    Use the LeafClusters or NodeClusters output vectors with the handle returned by the plot method to modify graphic elements of the phylogenetic tree object. For more information, see Validate Clusters in Phylogenetic Tree.

    Indices of branches being considered and criterion values, returned as a two-column matrix. The first column contains branch indices, and the second column contains criterion values. Each row corresponds to a step in the algorithm.

    To obtain the whole curve of the criterion versus the number of clusters in Branches, set Threshold to [] (empty) and do not specify MaxClust. Some criteria can be computationally intensive.

    References

    [1] Dudoit, S. and Fridlyan, J. (2002). A prediction-based resampling method for estimating the number of clusters in a dataset. Genome Biology 3(7), research 0036.1–0036.21.

    [2] Theodoridis, S. and Koutroumbas, K. (1999). Pattern Recognition (Academic Press), pp. 434–435.

    [3] Kaufman, L. and Rousseeuw, P.J. (1990). Finding Groups in Data: An Introduction to Cluster Analysis (New York, Wiley).

    [4] Calinski, R. and Harabasz, J. (1974). A dendrite method for cluster analysis. Commun Statistics 3, 1–27.

    [5] Hartigan, J.A. (1985). Statistical theory in clustering. J Classification 2, 63–76.

    Version History

    Introduced before R2006a