plotsomnd
(To be removed) Plot self-organizing map neighbor distances
plotsomnd will be removed in a future release. For more information,
see Transition Legacy Neural Network Code to dlnetwork Workflows.
For advice on updating your code, see Version History.
Syntax
plotsomnd(net)
Description
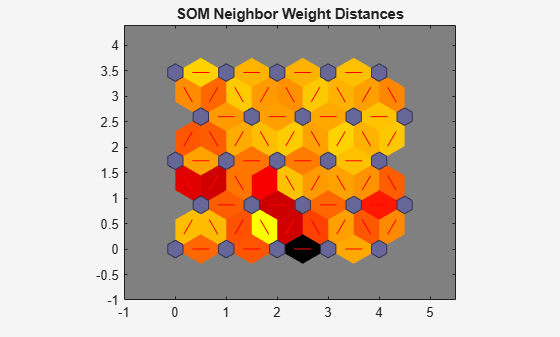
plotsomnd(net) plots a SOM layer showing
neurons as gray-blue patches and their direct neighbor relations with red lines. The
neighbor patches are colored from black to yellow to show how close each neuron’s weight
vector is to its neighbors.
This plot supports SOM networks with hextop and
gridtop topologies, but not tritop or
randtop.
Examples
Plot SOM Neighbor Distances
x = iris_dataset;
net = selforgmap([5 5]);
net = train(net,x);
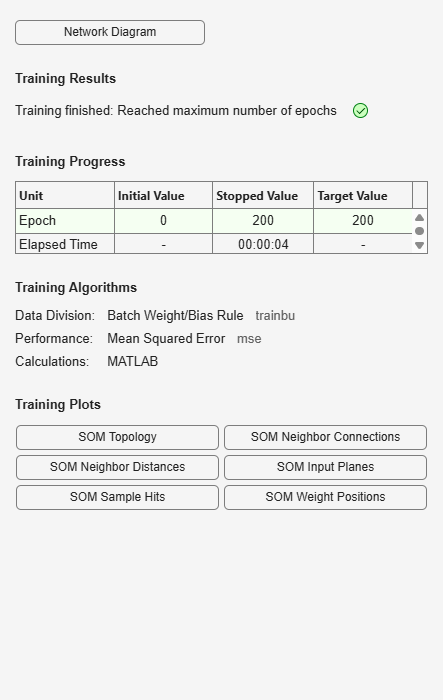
plotsomnd(net)
Version History
Introduced in R2008aSee Also
Time Series
Modeler | fitrnet (Statistics and Machine Learning Toolbox) | fitcnet (Statistics and Machine Learning Toolbox) | trainnet | trainingOptions | dlnetwork