plotsompos
R2026b(To be removed) Plot self-organizing map weight positions
plotsompos will be removed in a future release. For more information,
see Transition Legacy Neural Network Code to dlnetwork Workflows.
For advice on updating your code, see Version History.
Syntax
plotsompos(net)

plotsompos(net,inputs)
Description
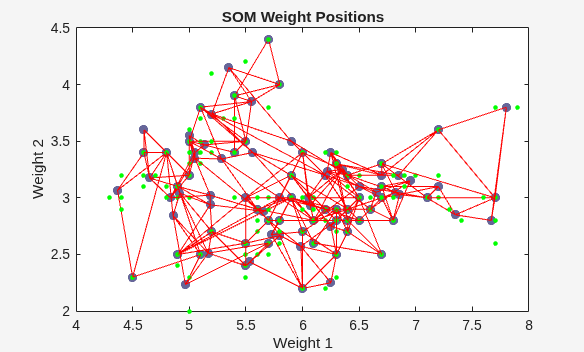
plotsompos(net) plots the input vectors as green dots and shows
how the SOM classifies the input space by showing blue-gray dots for
each neuron’s weight vector and connecting neighboring neurons with red lines.
plotsompos(net,inputs) plots the input data alongside the
weights.
Examples
Plot SOM Weight Positions
x = iris_dataset;
net = selforgmap([10 10]);
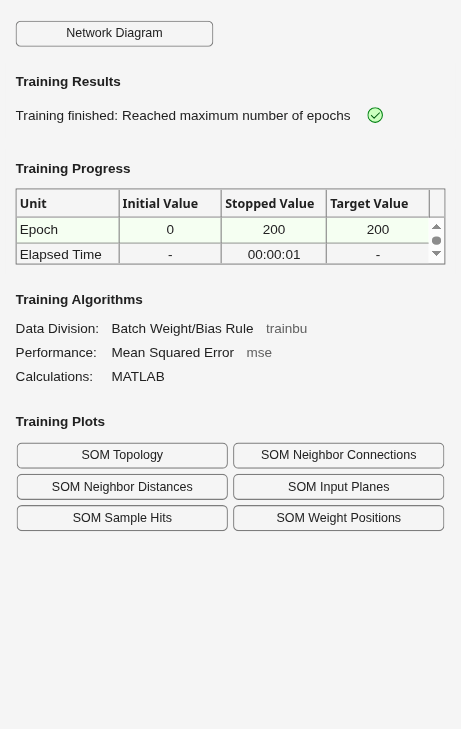
net = train(net,x);
plotsompos(net,x)
Version History
Introduced in R2008aSee Also
Time Series
Modeler | fitrnet (Statistics and Machine Learning Toolbox) | fitcnet (Statistics and Machine Learning Toolbox) | trainnet | trainingOptions | dlnetwork

