Bar Properties
Bar chart appearance and behavior
Bar properties control the appearance and
behavior of a Bar object. By changing property values,
you can modify certain aspects of the bar chart. Use dot notation to query and set
properties.
b = bar(1:10);
c = b.FaceColor
b.FaceColor = [0 0.5 0.5];
Color and Styling
Alternatively, you can specify some common colors by name. This table lists the named color options, the equivalent RGB triplets, and the hexadecimal color codes.
| Color Name | Short Name | RGB Triplet | Hexadecimal Color Code | Appearance |
|---|---|---|---|---|
"red" | "r" | [1 0 0] | "#FF0000" |
|
"green" | "g" | [0 1 0] | "#00FF00" |
|
"blue" | "b" | [0 0 1] | "#0000FF" |
|
"cyan"
| "c" | [0 1 1] | "#00FFFF" |
|
"magenta" | "m" | [1 0 1] | "#FF00FF" |
|
"yellow" | "y" | [1 1 0] | "#FFFF00" |
|
"black" | "k" | [0 0 0] | "#000000" |
|
"white" | "w" | [1 1 1] | "#FFFFFF" |
|
"none" | Not applicable | Not applicable | Not applicable | No color |
This table lists the default color palettes for plots in the light and dark themes.
| Palette | Palette Colors |
|---|---|
Before R2025a: Most plots use these colors by default. |
|
|
|
You can get the RGB triplets and hexadecimal color codes for these palettes using the orderedcolors and rgb2hex functions. For example, get the RGB triplets for the "gem" palette and convert them to hexadecimal color codes.
RGB = orderedcolors("gem");
H = rgb2hex(RGB);
Before R2023b: Get the RGB triplets using RGB =
get(groot,"FactoryAxesColorOrder").
Before R2024a: Get the hexadecimal color codes using H =
compose("#%02X%02X%02X",round(RGB*255)).
Starting in R2017b, the default value is an RGB triplet from the
ColorOrder property of the axes. In previous releases, the
default value was 'flat' and the colors were based on the
colormap.
Example: b = bar(1:10,'FaceColor','red')
Example: b.FaceColor = [0 0.5 0.5];
Example: b.FaceColor = 'flat';
Example: b.FaceColor = '#D2F9A7';
Control how the FaceColor property is set, specified as one of these values:
"auto"— MATLAB® controls the value of theFaceColorproperty by using theSeriesIndexproperty of theBarobject and theColorOrderproperty of the axes."manual"— You set the value of theFaceColorproperty directly, or indirectly as a function argument when you create theBarobject.
If you change the value of the FaceColor property manually, MATLAB changes the value of the FaceColorMode property to
"manual".
For a custom color, specify an RGB triplet or a hexadecimal color code.
An RGB triplet is a three-element row vector whose elements specify the intensities of the red, green, and blue components of the color. The intensities must be in the range
[0,1], for example,[0.4 0.6 0.7].A hexadecimal color code is a string scalar or character vector that starts with a hash symbol (
#) followed by three or six hexadecimal digits, which can range from0toF. The values are not case sensitive. Therefore, the color codes"#FF8800","#ff8800","#F80", and"#f80"are equivalent.
Alternatively, you can specify some common colors by name. This table lists the named color options, the equivalent RGB triplets, and the hexadecimal color codes.
| Color Name | Short Name | RGB Triplet | Hexadecimal Color Code | Appearance |
|---|---|---|---|---|
"red" | "r" | [1 0 0] | "#FF0000" |
|
"green" | "g" | [0 1 0] | "#00FF00" |
|
"blue" | "b" | [0 0 1] | "#0000FF" |
|
"cyan"
| "c" | [0 1 1] | "#00FFFF" |
|
"magenta" | "m" | [1 0 1] | "#FF00FF" |
|
"yellow" | "y" | [1 1 0] | "#FFFF00" |
|
"black" | "k" | [0 0 0] | "#000000" |
|
"white" | "w" | [1 1 1] | "#FFFFFF" |
|
"none" | Not applicable | Not applicable | Not applicable | No color |
This table lists the default color palettes for plots in the light and dark themes.
| Palette | Palette Colors |
|---|---|
Before R2025a: Most plots use these colors by default. |
|
|
|
You can get the RGB triplets and hexadecimal color codes for these palettes using the orderedcolors and rgb2hex functions. For example, get the RGB triplets for the "gem" palette and convert them to hexadecimal color codes.
RGB = orderedcolors("gem");
H = rgb2hex(RGB);
Before R2023b: Get the RGB triplets using RGB =
get(groot,"FactoryAxesColorOrder").
Before R2024a: Get the hexadecimal color codes using H =
compose("#%02X%02X%02X",round(RGB*255)).
Example: b = bar(1:10,'EdgeColor','red')
Example: b.EdgeColor = [0 0.5 0.5];
Example: b.EdgeColor = 'flat';
Example: b.EdgeColor = '#D2F9A7';
Face transparency, specified as a scalar in the range
[0,1]. A value of 1 is opaque and 0 is completely
transparent. Values between 0 and 1 are semitransparent.
Example: b = bar(1:10,'FaceAlpha',0.5)
Example: b.FaceAlpha = 0.5;
Edge transparency, specified as a scalar in the range
[0,1]. A value of 1 is opaque and 0 is completely
transparent. Values between 0 and 1 are semitransparent.
Example: b = bar(1:10,'EdgeAlpha',0.5)
Example: b.EdgeAlpha = 0.5;
Line style, specified as one of the options listed in this table.
| Line Style | Description | Resulting Line |
|---|---|---|
"-" | Solid line |
|
"--" | Dashed line |
|
":" | Dotted line |
|
"-." | Dash-dotted line |
|
"none" | No line | No line |
Series index, specified as a positive whole number or
"none". This property is useful for matching the
colors of graphics objects, such as text, plot lines, or other
Bar objects.
By default, the SeriesIndex property of a
Bar object is a number that corresponds to
its order of creation, starting at 1. MATLAB uses the number to calculate an index for automatically
assigning colors when you call plotting functions. The index refers to the
rows of the array stored in the ColorOrder property of
the axes. Any objects in the axes that have the same
SeriesIndex number will have the same color.
A SeriesIndex
value of "none" corresponds to a neutral color that does
not participate in the indexing scheme. (since R2023b)
How Manual Color Assignment Overrides SeriesIndex Behavior
To manually control the colors of the bars, use either of these approaches:
One color for all bars — Set the
FaceColorproperty to a color name, RGB triplet, or a hexadecimal color code.Different colors for one or more bars — Set the
FaceColorproperty to"flat". Then set theCDataproperty to an RGB triplet, matrix of RGB triplets, scalar colormap index, or a vector of colormap indices.
When you manually set the color of a Bar
object, MATLAB disables automatic color selection for that object and
allows your color to persist, regardless of the value of the
SeriesIndex property. The mode properties,
FaceColorMode and
CDataMode, indicate whether the colors have
been set manually (by you) or automatically. A value of
"manual" indicates manual selection, and a value
of "auto" indicates automatic selection.
To enable automatic selection again, set the
SeriesIndex property to a positive whole number
and perform either of these steps:
Set the
FaceColorModeproperty to"auto".Set the
FaceColorproperty to"flat", and set theCDataModeproperty to"auto".
In some cases, MATLAB sets the SeriesIndex property to
0, which also disables automatic color
selection.
Bar Labels
Since R2024b
Bar labels, specified as a string vector, cell array of character vectors, numeric vector, datetime vector, duration vector, or categorical vector. The length of the vector must match the number of bars.
When the chart displays multiple series of grouped or stacked bars, each
series corresponds to one Bar object. Set the
Labels property for each Bar
object that you want labeled.
Since R2026a
Control how the Labels property is set, specified as
one of these values:
"auto"— MATLAB controls the value of theLabelsproperty. The value can be:An empty string array (the default value).
The values in a table variable. The
SourceTableproperty specifies the table, and theLabelsVariableproperty specifies the variable. If either theSourceTableorLabelsVariableproperties are empty, MATLAB uses an empty string array.
"manual"— You set theLabelsproperty directly; it does not change.
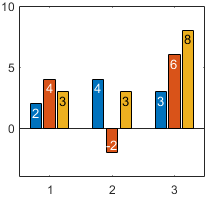
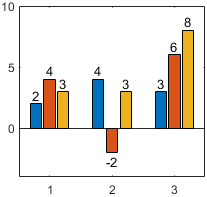
Since R2024b
Location of bar labels, specified as "end-inside" or
"end-outside". You might need to adjust the axes
limits to provide enough space for the labels.
| Value | Example |
|---|---|
|
|
|
|
Since R2024b
Control how the LabelLocation property is set,
specified as one of these values:
"auto"— MATLAB controls the value of theLabelLocationproperty depending on whether the bars are grouped or stacked."manual"— You set the value of theLabelLocationproperty directly, and the location does not change.
If you change the value of the LabelLocation property
manually, MATLAB changes the value of the
LabelLocationMode property to
"manual".
Since R2024b
Label color, specified as an RGB triplet, hexadecimal color code, color name, or short name. To use a different color for each label, specify an m-by-3 matrix of RGB triplets or a string vector of m hexadecimal color codes, color names, or short names. The value m is the number of labels (one for each bar).
For a custom color, specify an RGB triplet or a hexadecimal color code.
An RGB triplet is a three-element row vector whose elements specify the intensities of the red, green, and blue components of the color. The intensities must be in the range
[0,1], for example,[0.4 0.6 0.7].A hexadecimal color code is a string scalar or character vector that starts with a hash symbol (
#) followed by three or six hexadecimal digits, which can range from0toF. The values are not case sensitive. Therefore, the color codes"#FF8800","#ff8800","#F80", and"#f80"are equivalent.
Alternatively, you can specify some common colors by name. This table lists the named color options, the equivalent RGB triplets, and the hexadecimal color codes.
| Color Name | Short Name | RGB Triplet | Hexadecimal Color Code | Appearance |
|---|---|---|---|---|
"red" | "r" | [1 0 0] | "#FF0000" |
|
"green" | "g" | [0 1 0] | "#00FF00" |
|
"blue" | "b" | [0 0 1] | "#0000FF" |
|
"cyan"
| "c" | [0 1 1] | "#00FFFF" |
|
"magenta" | "m" | [1 0 1] | "#FF00FF" |
|
"yellow" | "y" | [1 1 0] | "#FFFF00" |
|
"black" | "k" | [0 0 0] | "#000000" |
|
"white" | "w" | [1 1 1] | "#FFFFFF" |
|
This table lists the default color palettes for plots in the light and dark themes.
| Palette | Palette Colors |
|---|---|
Before R2025a: Most plots use these colors by default. |
|
|
|
You can get the RGB triplets and hexadecimal color codes for these palettes using the orderedcolors and rgb2hex functions. For example, get the RGB triplets for the "gem" palette and convert them to hexadecimal color codes.
RGB = orderedcolors("gem");
H = rgb2hex(RGB);
Before R2023b: Get the RGB triplets using RGB =
get(groot,"FactoryAxesColorOrder").
Before R2024a: Get the hexadecimal color codes using H =
compose("#%02X%02X%02X",round(RGB*255)).
Since R2024b
Control how the LabelColor property is set, specified
as one of these values:
"auto"— MATLAB controls the value of theLabelColorproperty by selecting a neutral contrasting color."manual"— You set the value of theLabelColorproperty directly, and the color does not change.
If you change the value of the LabelColor property
manually, MATLAB changes the value of the LabelColorMode
property to "manual".
Font size, specified as a scalar value greater than zero in point units.
The default font size depends on the specific operating system and locale.
One point equals 1/72 inch.
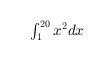
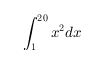
LaTeX Markup
To use LaTeX markup, set the interpreter to "latex". For inline
mode, surround the markup with single dollar signs ($). For
display mode, surround the markup with double dollar signs
($$).
| LaTeX Mode | Example | Result |
|---|---|---|
| Inline |
"$\int_1^{20} x^2 dx$" |
|
| Display |
"$$\int_1^{20} x^2 dx$$" |
|
The displayed text uses the default LaTeX font style. The
FontName, FontWeight, and
FontAngle properties do not have an effect. To change the
font style, use LaTeX markup.
The maximum size of the text that you can use with the LaTeX interpreter is 1200 characters. For multiline text, this reduces by about 10 characters per line.
MATLAB supports most standard LaTeX math mode commands. For more information, see Supported LaTeX Commands. For examples that use TeX and LaTeX, see Greek Letters and Special Characters in Chart Text.
Bar Graph Type
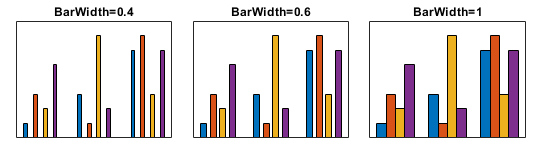
Relative width of individual bars, specified as a scalar in the range [0, 1]. Use this
property to control the space between the bars within a group. The default value is
0.8, which separates the bars slightly. If you set this property
to 1, the adjacent bars touch.
For example, these bar charts are same except for their BarWidth
values. As the BarWidth value increases, the bars become
wider.
The BarWidth value is
relative to the GroupWidth property, which controls the amount of
space for a group of bars. As the GroupWidth value increases, the
bars become wider. (since R2024a)
Plotting groups of bars produces multiple Bar objects. Changing the
BarWidth property of one object changes the value for all of
the objects.
Since R2024a
Width of the bar groups, specified as a scalar in the range [0, 1]. This
property specifies the fraction of the available space for a group of bars.
It has no effect if the bars are not grouped. A value of
1 uses all of the available space for each group, but
it minimizes the space between groups. Smaller values produce thinner bars
with more space between the groups.
For example, these bar charts are the same except for their
GroupWidth values. As the
GroupWidth value increases, the bars become wider
and the groups become harder to distinguish.

Plotting groups of bars produces multiple Bar objects.
Changing the GroupWidth property of one object changes
the value for all of the objects.
Since R2024a
Control how the GroupWidth property is set, specified
as one of these values:
"auto"— MATLAB selects theGroupWidthvalue based on the number of groups."manual"— You specify theGroupWidthvalue.
Horizontal bar chart, specified as 'on' or
'off', or as numeric or logical 1
(true) or 0
(false). A value of 'on' is
equivalent to true, and 'off' is
equivalent to false. Thus, you can use the value of this
property as a logical value. The value is stored as an on/off logical value
of type matlab.lang.OnOffSwitchState.
Baseline
Data
Color data, specified as one of these values:
RGB triplet — Single RGB color value applies to all bars.
Three-column matrix — One color per bar. Each row in the matrix specifies an RGB triplet for a particular bar.
Scalar — Single color applies to all bars, where the color comes from the colormap.
Vector — One color per bar. The colors come from the colormap.
By default, when you create a bar chart, the CData property
contains a three-column matrix of RGB triplets. You can change the color for a
particular bar by changing the corresponding row in the matrix.
This property applies only when the FaceColor or
EdgeColor property is set to 'flat'.
Example
Change the color for a particular bar by setting the FaceColor
property to 'flat'. Then change the corresponding row in the
CData matrix to the new RGB triplet. For example, change the
color of the second bar.
b = bar(1:10,'FaceColor','flat');
b.CData(2,:) = [0 0.8 0.8];

Control how the CData property is set, specified as one of these values:
'auto'— MATLAB controls the value of theCDataproperty. The value can be:One of the colors from the
ColorOrderproperty of the axes. MATLAB uses theSeriesIndexproperty of theBarobject and theColorOrderproperty of the axes to select a color. This is the default behavior.The values in a table variable. The
SourceTableproperty specifies the table, and theColorVariableproperty specifies the variable. If either of these properties are empty, then the color data comes from theColorOrderproperty of the axes.
'manual'— You control the value of theCDataproperty manually, either by specifying a color when you call a plotting function or by setting theCDataproperty on theBarobject after plotting.
Bar locations, specified as a vector with no repeating values.
For vertical bar charts, the values are the bar locations along the x-axis.
For horizontal bar charts, the values are the bar locations along the y-axis.
Alternatively, specify the bar locations using the input argument
X to the bar or
barh function. If you do not specify
X, then the indices of the values in
YData determine the bar locations.
XData and YData must have equal
lengths.
Example: 1:10
Data Types: single | double | int8 | int16 | int32 | int64 | uint8 | uint16 | uint32 | uint64 | categorical | datetime | duration | string (since R2023b) | cell (since R2023b)
Control how the XData property is set, specified as one of these values:
"auto"— MATLAB controls the value of theXDataproperty. TheXDatavalue can be:The indices of the values in
YData.The values in a table variable. The
SourceTableproperty specifies the table, and theXVariableproperty specifies the variable. If either theSourceTableorXVariableproperties are empty, theYDataindices are used.
"manual"— TheXDataproperty is set directly and does not update automatically. This is the case when you specify the coordinates using a vector or a matrix.
Bar lengths, specified as a vector. Alternatively, specify the bar lengths
using the input argument Y to the bar
or barh function.
XData and YData must have equal
lengths.
Example: 1:10
Data Types: single | double | int8 | int16 | int32 | int64 | uint8 | uint16 | uint32 | uint64 | duration
Since R2026a
Control how the YData property is set, specified as one
of these values:
"auto"— TheYDataproperty updates automatically based on theSourceTableandYVariableproperties. This is the case when you pass a table to functions such asbarorbarh."manual"— TheYDataproperty is set directly and does not update automatically. This is the case when you specify the y-coordinates using a vector or matrix.
This property is read-only.
x-coordinates of the tips of the bars, returned as a
vector. These coordinates are useful when you want to add text, error bars,
or other objects to the tips of the bars. For example, you can pass the
value of this property to the text function when you
want to add text to the tips of the bars.
This property is read-only.
y-coordinates of the tips of the bars, returned as a
vector. These coordinates are useful when you want to add text, error bars,
or other objects to the tips of the bars. For example, you can pass the
value of this property to the text function when you
want to add text to the tips of the bars.
Table Data
Since R2026a