Simulink.analytics.getMetrics
Get descriptive statistics for data stored in
Simulink.sdi.Signal objects
Since R2026a
Syntax
Description
signalStats = Simulink.analytics.getMetrics(signalID)Simulink.sdi.Signal object specified by the signal identifier
signalID.
signalStats = Simulink.analytics.getMetrics(signalID,startTime)startTime and
the end of simulation.
signalStats = Simulink.analytics.getMetrics(signalID,startTime,endTime)startTime and endTime, inclusive.
Examples
Suppose you log a signal generated from a Random
Number block to the Simulation Data Inspector. To get descriptive statistics for
signal, use the Simulink.analytics.getMetrics function.
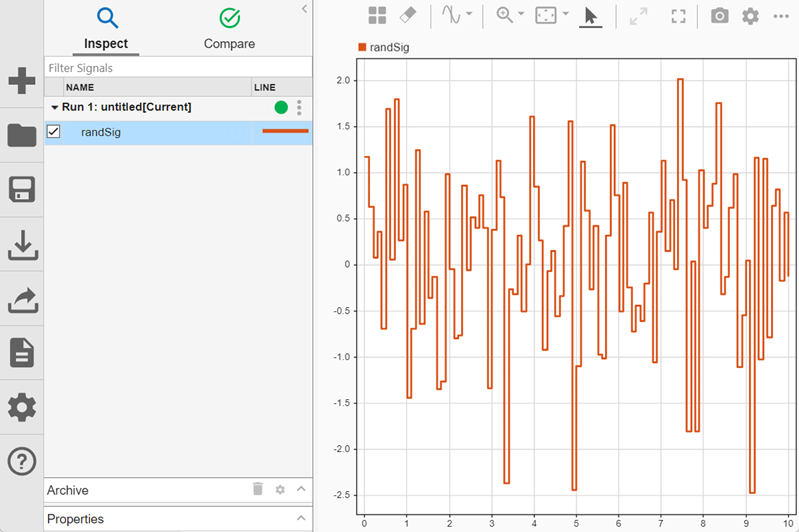
Get the signal ID for the signal named randSig.
runObj = Simulink.sdi.Run.getLatest;
sigID = getSignalIDsByName(runObj,"randSig");
Use the Simulink.analytics.getMetrics function to return
descriptive statistics for the signal.
sigStats = Simulink.analytics.getMetrics(sigID)
sigStats =

  struct with fields:

           min: -2.4828
           max: 2.0185
    peakToPeak: 4.5013
          mean: 0.0708
        median: 0.1479
           std: 0.9490
           rms: 0.9470
To find the descriptive statistics near the end of the simulation, specify the
starting time. For example, to find the descriptive statistics for the last two seconds
of the 10 second simulation, specify startTime as
8.
sigStatsEnd = Simulink.analytics.getMetrics(sigID,8)
sigStatsEnd =

  struct with fields:

           min: -2.4828
           max: 1.7524
    peakToPeak: 4.2352
          mean: 0.1382
        median: 0.3946
           std: 0.9735
           rms: 0.9600
To find the descriptive statistics in a specific interval, specify the start and end time of the interval. For example, find the descriptive statistics in the interval between 2 seconds and 4 seconds.
sigStatsInterval = Simulink.analytics.getMetrics(sigID,2,4)
sigStatsInterval =

  struct with fields:

           min: -2.3775
           max: 1.6065
    peakToPeak: 3.9840
          mean: 0.0684
        median: 0.3180
           std: 0.9016
rms: 0.8825Suppose you log a signal generated from a Random
Number block using a Record block. To get descriptive statistics
for signal, use the Simulink.analytics.getMetrics function.
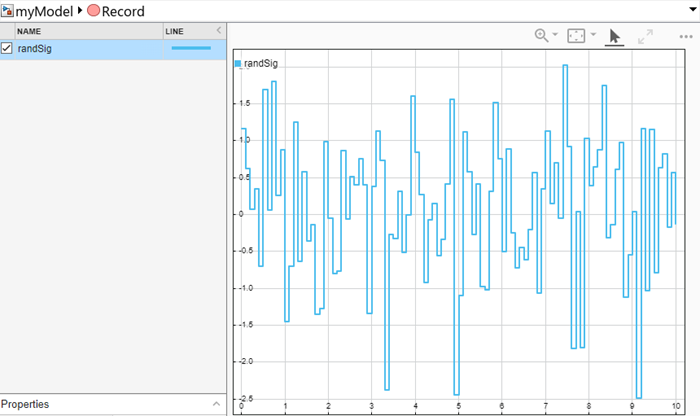
Get the signal ID for signal named randSig in the
Record block.
recordSigIds = get_param("myModel/Record","signalIDs");
sigID = recordSigIds(1);
Use the Simulink.analytics.getMetrics function to return
descriptive statistics for the signal.
recordSigStats = Simulink.analytics.getMetrics(sigID)
recordSigStats =

  struct with fields:

           min: -2.4828
           max: 2.0185
    peakToPeak: 4.5013
          mean: 0.0708
        median: 0.1479
           std: 0.9490
rms: 0.9470Suppose you add a signal generated from a Random
Number block to a Playback block. To get descriptive statistics
for signal, use the Simulink.analytics.getMetrics function.
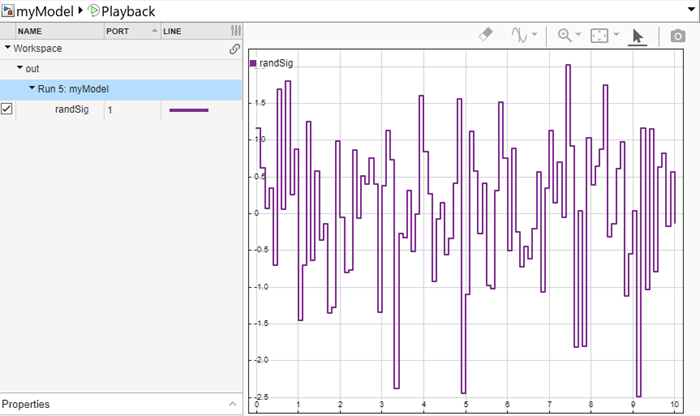
Get the signal ID for signal named randSig in the
Playback block.
playbackSigIds = get_param("myModel/Playback","signalIDs");
sigID = playbackSigIds(1);
Use the Simulink.analytics.getMetrics function to return
descriptive statistics for the signal.
playbackSigStats = Simulink.analytics.getMetrics(sigID)
playbackSigStats =

  struct with fields:

           min: -2.4828
           max: 2.0185
    peakToPeak: 4.5013
          mean: 0.0708
        median: 0.1479
           std: 0.9490
           rms: 0.9470
Input Arguments
Output Arguments
Version History
Introduced in R2026a