at
Execute chart at event broadcast or specified time
Description
at( returns
n,E)true if the event E has occurred exactly
n times since the associated state became active. Otherwise, the
operator returns false.
at( returns
n,tick)true if the chart has woken up exactly n times since
the associated state became active. Otherwise, the operator returns
false.
The implicit event tick is not supported when a Stateflow® chart in a Simulink® model has input events.
at( returns
n,sec)true if exactly n seconds have elapsed since the
associated state became active. Otherwise, the operator returns
false.
In standalone charts in MATLAB®, specify n with a value greater than or equal to
0.001. The operator creates a MATLAB
timer object that generates an implicit event to wake up the chart. MATLAB
timer objects are limited to 1 millisecond precision. For more
information, see Events in Standalone Charts.
The
timerobject is created when the chart finishes executing theentryactions of the associated state and its substates. If you specifynas an expression whose value changes during chart execution, the chart does not adjust the temporal delay of thetimerobject.The
timerobject starts running at the end of the chart step when the associated state becomes active. This step can include the execution of other parallel states in the chart.If the chart is processing another operation when it receives the implicit event from the
timerobject, the chart queues the event. When the current step is completed, the chart processes the event.If the state associated with the temporal logic operator becomes inactive before the chart processes the implicit event, the event does not wake up the chart.
Note
This syntax is supported only in standalone charts in MATLAB. For charts in Simulink models, use the after operator instead.
For more information, see Do Not Use at for Absolute-Time Temporal Logic in Charts in Simulink Models.
Examples
Display a status message when the chart processes the third broadcast
of the event E after the state became active.
on at(3,E):
   disp("ON");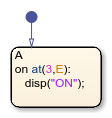
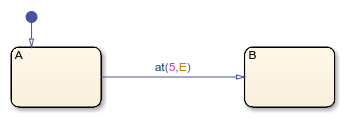
Transition out of the associated state when the chart processes the
fifth broadcast of the event E after the state became active.
at(5,E)
Transition out of the associated state if the state has been active
for exactly five broadcasts of the event E.
In charts in a Simulink model, enter:
[at(5,E)]
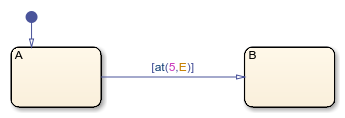
Conditional notation for temporal logic operators is not supported in standalone charts in MATLAB.
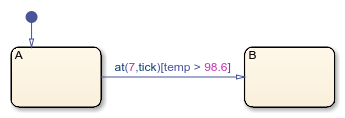
Transition out of the associated state when the chart wakes up for
the seventh time since the state became active, but only if the variable
temp is greater than 98.6.
at(7,tick)[temp > 98.6]
Set the temp variable to HIGH
if the state has been active for exactly 12.3 seconds.
In standalone charts in MATLAB, enter:
on at(12.3,sec):
   temp = HIGH;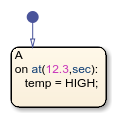
Using every as an absolute-time temporal logic operator is not
supported in charts in Simulink models.
Tips
You can use quotation marks to enclose the keywords
'tick'and'sec'. For example,at(5,'tick')is equivalent toat(5,tick).The Stateflow chart resets the counter used by the
atoperator each time the associated state reactivates.Standalone charts in MATLAB define absolute-time temporal logic in terms of wall-clock time, which is limited to 1 millisecond precision.
Version History
Introduced in R2014b