Execution in MATLAB
Design logic by using state charts and execute that logic as MATLAB programs. Execute and unit test your chart in the Stateflow editor. Control the behavior of user interfaces and data processing applications through your chart.
Functions
Stateflow Syntax
Topics
- Create Stateflow Charts for Execution as MATLAB Objects
Save standalone Stateflow charts outside of Simulink® models.
- Execute and Unit Test Stateflow Chart Objects
Run Stateflow charts in MATLAB or through the Stateflow Editor.
- Execute Stateflow Chart Objects Through Scripts and Models
Create a MATLAB script or a Simulink model that invokes a standalone Stateflow chart.
- Convert MATLAB Code into Stateflow Flow Charts
Produce flow charts from your MATLAB code.
Troubleshooting
Debug a Standalone Stateflow Chart
Interrupt execution to step through each action in a Stateflow chart.
Related Information
Featured Examples

Design Human-Machine Interface Logic by Using Stateflow Charts
Model the logic of a lamp app in a standalone Stateflow chart.

Model a Communications Protocol by Using Chart Objects
Use a standalone Stateflow® chart to model a frame-synchronization and symbol-detection component in a communications system. Standalone charts implement classic chart semantics with MATLAB® as the action language. You can program the chart by using the full functionality of MATLAB, including those functions that are restricted for code generation in Simulink®. For more information, see Create Stateflow Charts for Execution as MATLAB Objects.

Implement a Financial Strategy by Using Stateflow
Use a standalone Stateflow® chart to model a financial trading strategy known as Bollinger Bands. Standalone charts implement classic chart semantics with MATLAB® as the action language. You can program the chart by using the full functionality of MATLAB, including those functions that are restricted for code generation in Simulink®. For more information, see Create Stateflow Charts for Execution as MATLAB Objects.

Model a Fitness App by Using Standalone Charts
Implement a fitness tracker by using multiple standalone charts and a MATLAB app.

Model Bluetooth Low Energy Link Layer Using Stateflow
Use a standalone Stateflow chart to model the state machine in a Bluetooth® low energy link layer.
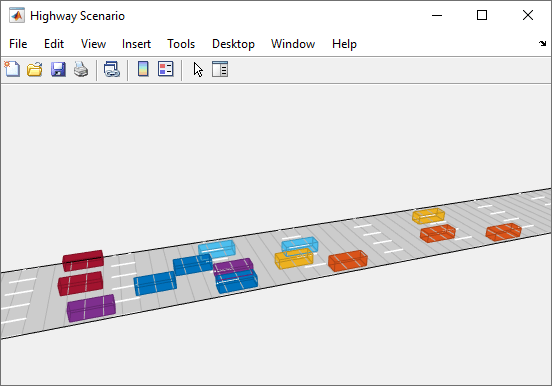
Automate Control of Intelligent Vehicles by Using Stateflow Charts
Model a highway scenario with intelligent vehicles that are controlled by the same decision logic.
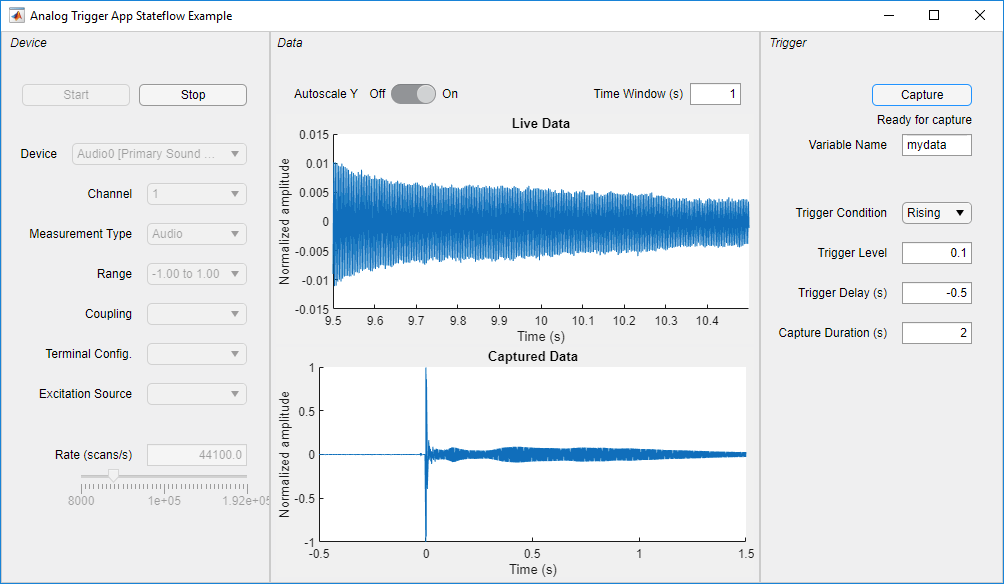
Analog Triggered Data Acquisition Using Stateflow Charts
Create an analog-triggered data acquisition app by using Stateflow, Data Acquisition Toolbox™, and App Designer.

Pick-and-Place Workflow Using Stateflow for MATLAB
Design a pick-and-place workflow for a robotic manipulator such as Kinova® Gen3 using Stateflow.