Main Content

clusterdata

Construct agglomerative clusters from data

Description

example

T = clusterdata(X,cutoff) returns cluster indices for each observation (row) of an input data matrix X, given a threshold cutoff for cutting an agglomerative hierarchical tree that the linkage function generates from X.

clusterdata supports agglomerative clustering and incorporates the pdist, linkage, and cluster functions, which you can use separately for more detailed analysis. See Algorithm Description for more details.

example

T = clusterdata(X,Name,Value) specifies clustering options using one or more name-value pair arguments. You must specify either Cutoff or MaxClust. For example, specify 'MaxClust',5 to find a maximum of five clusters.

Examples

collapse all

Find and visualize a maximum of three clusters in a randomly generated data set using two different approaches:

  1. Specify a value for the cutoff input argument.

  2. Specify a value for the 'MaxClust' name-value pair argument.

Create a sample data set consisting of randomly generated data from three standard uniform distributions.

rng('default');  % For reproducibility
X = [gallery('uniformdata',[10 3],12); ...
    gallery('uniformdata',[10 3],13)+1.2; ...
    gallery('uniformdata',[10 3],14)+2.5];
y = [ones(10,1);2*(ones(10,1));3*(ones(10,1))]; % Actual classes

Create a scatter plot of the data.

scatter3(X(:,1),X(:,2),X(:,3),100,y,'filled')
title('Randomly Generated Data in Three Clusters');

Figure contains an axes object. The axes object with title Randomly Generated Data in Three Clusters contains an object of type scatter.

Find a maximum of three clusters in the data by specifying the value 3 for the cutoff input argument.

T1 = clusterdata(X,3);

Because the value of cutoff is greater than 2, clusterdata interprets cutoff as the maximum number of clusters.

Plot the data with the resulting cluster assignments.

scatter3(X(:,1),X(:,2),X(:,3),100,T1,'filled')
title('Result of Clustering');

Figure contains an axes object. The axes object with title Result of Clustering contains an object of type scatter.

Find a maximum of three clusters by specifying the value 3 for the 'MaxClust' name-value pair argument.

T2 = clusterdata(X,'Maxclust',3); 

Plot the data with the resulting cluster assignments.

scatter3(X(:,1),X(:,2),X(:,3),100,T2,'filled')
title('Result of Clustering');

Figure contains an axes object. The axes object with title Result of Clustering contains an object of type scatter.

Using both approaches, 
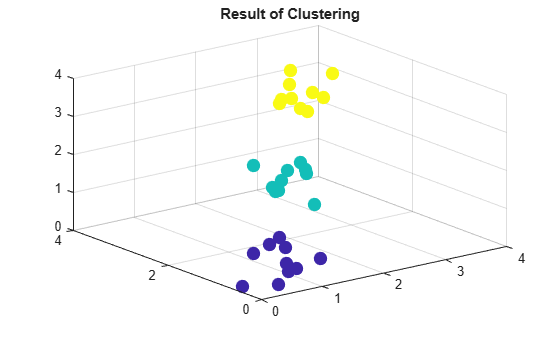
clusterdata identifies the three distinct clusters in the data.

Create a hierarchical cluster tree and find clusters in one step. Visualize the clusters using a 3-D scatter plot.

Create a 20,000-by-3 matrix of sample data generated from the standard uniform distribution.

rng('default');  % For reproducibility
X = rand(20000,3);

Find a maximum of four clusters in a hierarchical cluster tree created using the ward linkage method. Specify 'SaveMemory' as 'on' to construct clusters without computing the distance matrix. Otherwise, you can receive an out-of-memory error if your machine does not have enough memory to hold the distance matrix.

T = clusterdata(X,'Linkage','ward','SaveMemory','on','Maxclust',4);

Plot the data with each cluster shown in a different color.

scatter3(X(:,1),X(:,2),X(:,3),10,T)

Figure contains an axes object. The axes object contains an object of type scatter.

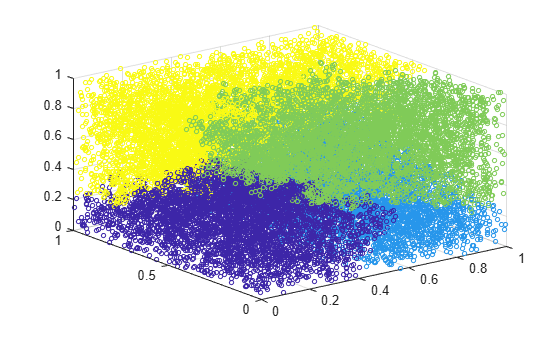
clusterdata identifies four clusters in the data.

Input Arguments

collapse all

Input data, specified as a numeric matrix with two or more rows. The rows represent observations, and the columns represent categories or dimensions.

Data Types: single | double

Threshold for cutting the hierarchical tree defined by linkage, specified as a positive scalar between 0 and 2 or a positive integer ≥ 2. clusterdata behaves differently depending on the value specified for cutoff.

  • If 0 < cutoff < 2, then clusterdata forms clusters when inconsistent values are greater than cutoff.

  • If cutoff is an integer ≥ 2, then clusterdata forms a maximum of cutoff clusters.

When you specify cutoff, you cannot specify any name-value pair arguments.

Example: clusterdata(X,3)

Data Types: single | double

Name-Value Arguments

Specify optional pairs of arguments as Name1=Value1,...,NameN=ValueN, where Name is the argument name and Value is the corresponding value. Name-value arguments must appear after other arguments, but the order of the pairs does not matter.

Before R2021a, use commas to separate each name and value, and enclose Name in quotes.

Example: clusterdata(X,'Linkage','ward','MaxClust',3) specifies creating a maximum of three clusters of X using Ward linkage.

Criterion for defining clusters in a hierarchical cluster tree, specified as the comma-separated pair consisting of 'Criterion' and either 'inconsistent' or 'distance'. When you specify 'Criterion', you must also specify a value for MaxClust or Cutoff.

Example: clusterdata(X,'Criterion','distance','Cutoff',.5)

Data Types: char | string

Cutoff for inconsistent or distance criterion, specified as the comma-separated pair consisting of 'Cutoff' and a positive scalar. clusterdata uses Cutoff as a threshold for either the heights or the inconsistency coefficients of nodes, depending on the value of Criterion. If you specify a value for 'Cutoff' without specifying the criterion for defining clusters, then clusterdata uses the 'inconsistent' criterion by default.

  • If 'Criterion' is 'distance', then clusterdata groups all leaves at or below a node into a cluster, provided that the height of the node is less than Cutoff.

  • If 'Criterion' is 'inconsistent', then the inconsistent values of a node and all its subnodes must be less than Cutoff for clusterdata to group them into a cluster.

You must specify either Cutoff or MaxClust.

Example: clusterdata(X,'Cutoff',0.2)

Data Types: single | double

Depth for computing inconsistent values, specified as the comma-separated pair consisting of 'Depth' and a numeric scalar. clusterdata evaluates inconsistent values by looking to the specified depth below each node in the hierarchical cluster tree. When you specify 'Depth', you must also specify a value for MaxClust or Cutoff.

Example: clusterdata(X,'Depth',3,'Cutoff',0.5)

Data Types: single | double

Distance metric, specified as the comma-separated pair consisting of 'Distance' and any distance metric accepted by the pdist function, as descried in the following table. When you specify 'Distance', you must also specify a value for MaxClust or Cutoff.

MetricDescription
'euclidean'

Euclidean distance (default)

'squaredeuclidean'

Squared Euclidean distance. (This option is provided for efficiency only. It does not satisfy the triangle inequality.)

'seuclidean'

Standardized Euclidean distance. Each coordinate difference between observations is scaled by dividing by the corresponding element of the standard deviation, S = std(X,'omitnan').

'mahalanobis'

Mahalanobis distance using the sample covariance of X, C = cov(X,'omitrows')

'cityblock'

City block distance

'minkowski'

Minkowski distance. The default exponent is 2. To use a different exponent P, specify P after 'minkowski', where P is a positive scalar value: 'minkowski',P.

'chebychev'

Chebychev distance (maximum coordinate difference)

'cosine'

One minus the cosine of the included angle between points (treated as vectors)

'correlation'

One minus the sample correlation between points (treated as sequences of values)

'hamming'

Hamming distance, which is the percentage of coordinates that differ

'jaccard'

One minus the Jaccard coefficient, which is the percentage of nonzero coordinates that differ

'spearman'

One minus the sample Spearman's rank correlation between observations (treated as sequences of values)

@distfun

Custom distance function handle. A distance function has the form

function D2 = distfun(ZI,ZJ)
% calculation of distance
...
where

  • ZI is a 1-by-n vector containing a single observation.

  • ZJ is an m2-by-n matrix containing multiple observations. distfun must accept a matrix ZJ with an arbitrary number of observations.

  • D2 is an m2-by-1 vector of distances, and D2(k) is the distance between observations ZI and ZJ(k,:).

If your data is not sparse, using a built-in distance is generally faster than using a function handle.

For more information, see Distance Metrics.

Example: clusterdata(X,'Distance','minkowski','MaxClust',4)

Data Types: char | string | function_handle

Algorithm for computing distance between clusters, specified as the comma-separated pair consisting of 'Linkage' and any algorithm accepted by the linkage function, as described in the following table. When you specify 'Linkage', you must also specify a value for MaxClust or Cutoff.

AlgorithmDescription
'average'

Unweighted average distance (UPGMA)

'centroid'

Centroid distance (UPGMC), appropriate for Euclidean distances only

'complete'

Farthest distance

'median'

Weighted center of mass distance (WPGMC), appropriate for Euclidean distances only

'single'

Shortest distance

'ward'

Inner squared distance (minimum variance algorithm), appropriate for Euclidean distances only

'weighted'

Weighted average distance (WPGMA)

For more information, see Linkages.

Example: clusterdata(X,'Linkage','median','MaxClust',4)

Data Types: char | string

Maximum number of clusters to form, specified as the comma-separated pair consisting of 'MaxClust' and a positive integer.

You must specify either Cutoff or MaxClust.

Example: clusterdata(X,'MaxClust',4)

Data Types: single | double

Option for saving memory, specified as the comma-separated pair consisting of 'SaveMemory' and either 'on' or 'off'. When you specify 'SaveMemory', you must also specify a value for MaxClust or Cutoff.

The 'on' setting causes clusterdata to construct clusters without computing the distance matrix. The 'on' setting applies when both of these conditions are satisfied:

  • Linkage is 'centroid', 'median', or 'ward'.

  • Distance is 'euclidean' (default).

When these two conditions apply, the default value for 'SaveMemory' is 'on' if X has 20 columns or fewer, or if the computer does not have enough memory to store the distance matrix. Otherwise, the default value for 'SaveMemory' is 'off'.

When 'SaveMemory' is 'on', the linkage run time is proportional to the number of dimensions (number of columns of X). When 'SaveMemory' is 'off', the linkage memory requirement is proportional to N2, where N is the number of observations. Choosing the best (least-time) setting for 'SaveMemory' depends on the problem dimensions, number of observations, and available memory. The default 'SaveMemory' setting is a rough approximation of an optimal setting.

Example: 'SaveMemory','on'

Data Types: char | string

Output Arguments

collapse all

Cluster indices, returned as a numeric column vector. T has as many rows as X, and each row of T indicates the cluster assignment of the corresponding observation in X.

Tips

  • If 'Linkage' is 'centroid' or 'median', then linkage can produce a cluster tree that is not monotonic. This result occurs when the distance from the union of two clusters, r and s, to a third cluster is less than the distance between r and s. In this case, in a dendrogram drawn with the default orientation, the path from a leaf to the root node takes some downward steps. To avoid this result, specify another value for 'Linkage'. The following image shows a nonmonotonic cluster tree.

    Nonmonotonic cluster tree

    In this case, cluster 1 and cluster 3 are joined into a new cluster, while the distance between this new cluster and cluster 2 is less than the distance between cluster 1 and cluster 3.

Algorithms

If you specify a value c for the cutoff input argument, then T = clusterdata(X,c) performs the following steps:

  1. Create a vector of the Euclidean distance between pairs of observations in X by using pdist.

    Y = pdist(X,'euclidean')

  2. Create an agglomerative hierarchical cluster tree from Y by using linkage with the 'single' method for computing the shortest distance between clusters.

    Z = linkage(Y,'single')

  3. If 0 < c < 2, use cluster to define clusters from Z when inconsistent values are less than c.

    T = cluster(Z,'Cutoff',c)

  4. If c is an integer value ≥ 2, use cluster to find a maximum of c clusters from Z.

    T = cluster(Z,'MaxClust',c)

Alternative Functionality

If you have a hierarchical cluster tree Z (the output of the linkage function for the input data matrix X), you can use cluster to perform agglomerative clustering on Z and return the cluster assignment for each observation (row) in X.

Version History

Introduced before R2006a