Hypothesis Tests
Statistics and Machine Learning Toolbox™ provides parametric and nonparametric hypothesis tests to help you determine if your sample data comes from a population with particular characteristics.
Distribution tests, such as Anderson-Darling and one-sample Kolmogorov-Smirnov, test whether sample data comes from a population with a particular distribution. Test whether two sets of sample data have the same distribution using tests such as two-sample Kolmogorov-Smirnov.
Location tests, such as z-test and one-sample t-test, test whether sample data comes from a population with a particular mean or median. Test two or more sets of sample data for the same location value using a two-sample t-test or multiple comparison test.
Dispersion tests, such as Chi-square variance, test whether sample data comes from a population with a particular variance. Compare the variances of two or more sample data sets using a two-sample F-test or multiple-sample test.
Determine additional features of sample data by cross-tabulating, conducting a run test for randomness, and determine the sample size and power for a hypothesis test.
Functions
Topics
- Available Hypothesis Tests
View hypothesis tests of distributions and statistics.
- Hypothesis Testing with Two Samples
Use hypothesis testing to analyze gas prices measured across the state of Massachusetts during two separate months.
- Hypothesis Test Terminology
All hypothesis tests share the same basic terminology and structure.
- Hypothesis Test Assumptions
Different hypothesis tests make different assumptions about the distribution of the random variable being sampled in the data.
Featured Examples
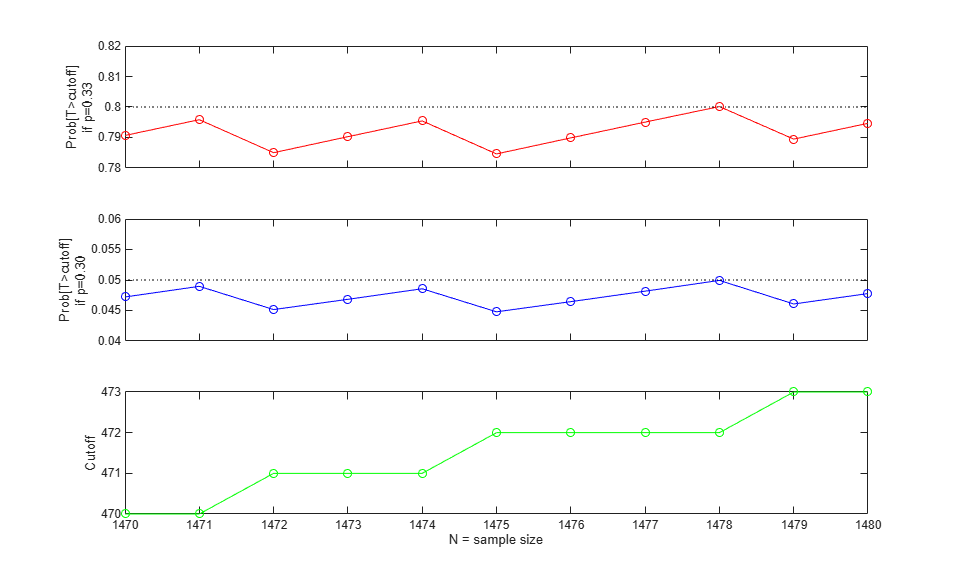
Selecting a Sample Size
Determine the number of samples or observations needed to carry out a statistical test. It illustrates sample size calculations for a simple problem, then shows how to use the sampsizepwr function to compute power and sample size for two more realistic problems. Finally, it illustrates the use of Statistics and Machine Learning Toolbox™ functions to compute the required sample size for a test that the sampsizepwr function does not support.