fmesh
Plot 3-D mesh
Syntax
Description
fmesh( creates a mesh plot of the
symbolic expression f)f(x,y) over the default interval
[-5 5] for x and
y.
fmesh( plots f,[xmin xmax
ymin ymax])f(x,y) over the interval
[xmin xmax] for x and [ymin
ymax] for y. The fmesh function uses
symvar to order the variables and assign intervals.
fmesh( plots the
parametric mesh funx,funy,funz)x = x(u,v), y = y(u,v),
z =
                        z(u,v)
over the interval [-5 5]
for u and v.
fmesh( plots the parametric mesh funx,funy,funz,[uvmin
uvmax])x =
x(u,v), y = y(u,v), z =
z(u,v) over the interval [uvmin uvmax] for
u and v.
fmesh( plots the parametric mesh funx,funy,funz,[umin
umax vmin vmax])x =
x(u,v), y = y(u,v), z =
z(u,v) over the interval [umin umax] for
u and [vmin vmax] for
v. The fmesh function uses
symvar to order the parametric variables and assign intervals.
fmesh(___, uses
the LineSpec)LineSpec to set the line style, marker symbol, and plot
color.
fmesh(___,
specifies surface properties using one or more Name,Value)Name,Value
pair arguments. Use this option with any of the input argument combinations in
the previous syntaxes.
fmesh( plots into
the axes with the object ax,___)ax instead of the current axes
object gca.
obj = fmesh(___)
Examples
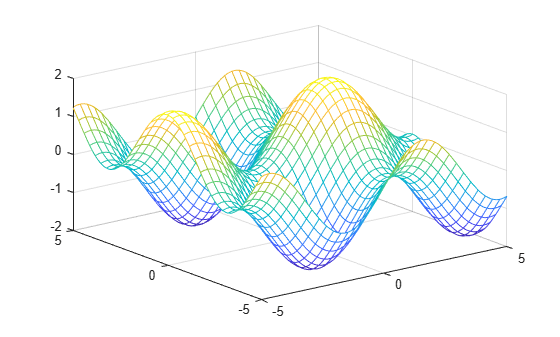
Plot a mesh of the input over the default range and .
syms x y
fmesh(sin(x)+cos(y))
Plot a 3-D mesh of the real part of over the default range and .
syms f(x,y)
f(x,y) = real(atan(x + i*y));
fmesh(f)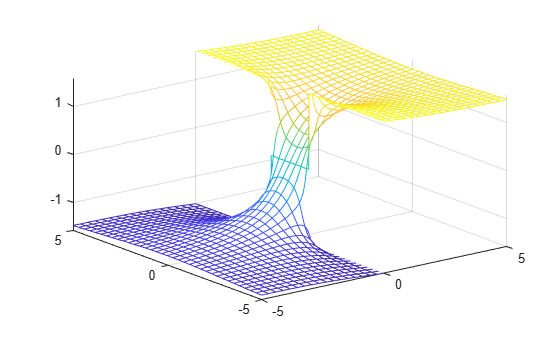
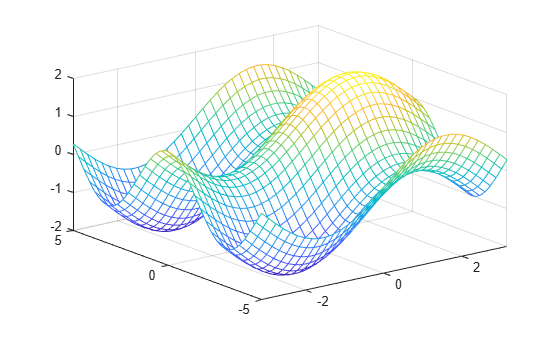
Plot over and by specifying the plotting interval as the second argument of fmesh.
syms x y
f = sin(x) + cos(y);
fmesh(f, [-pi pi -5 5])
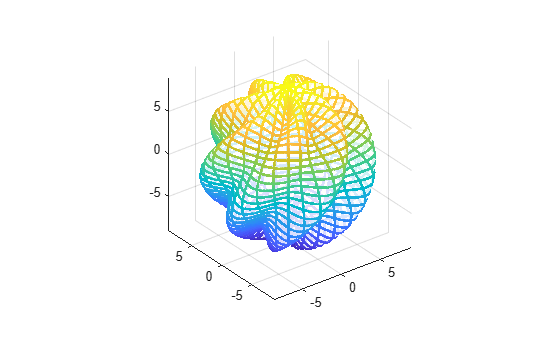
Plot the parameterized mesh
for and . Make the aspect ratio of the axes equal using axis equal. See the entire mesh by making the mesh partially transparent using alpha.
syms s t
r = 8 + sin(7*s + 5*t);
x = r*cos(s)*sin(t);
y = r*sin(s)*sin(t);
z = r*cos(t);
fmesh(x, y, z, [0 2*pi 0 pi], 'Linewidth', 2)
axis equal
alpha(0.8)
Input Arguments
Expression or function to be plotted, specified as a symbolic expression or function.
Plotting interval for x- and y-axes, specified as a vector of two numbers.
The default is [-5 5].
Plotting interval for x- and y-axes, specified as a vector of four
numbers. The default is [-5 5 -5 5].
Parametric functions of u and v,
specified as a symbolic expression or function.
Plotting interval for u and v axes,
specified as a vector of two numbers. The default is [-5
5].
Plotting interval for u and v,
specified as a vector of four numbers. The default is [-5 5 -5
5].
Axes object. If you do not specify an axes object, then
fmesh uses the current axes.
Line style, marker, and color, specified as a string scalar or character vector containing symbols. The symbols can appear in any order. You do not need to specify all three characteristics (line style, marker, and color). For example, if you omit the line style and specify the marker, then the plot shows only the marker and no line.
Example: "--or" is a red dashed line with circle markers.
| Line Style | Description | Resulting Line |
|---|---|---|
"-" | Solid line |
|
"--" | Dashed line |
|
":" | Dotted line |
|
"-." | Dash-dotted line |
|
| Marker | Description | Resulting Marker |
|---|---|---|
"o" | Circle |
|
"+" | Plus sign |
|
"*" | Asterisk |
|
"." | Point |
|
"x" | Cross |
|
"_" | Horizontal line |
|
"|" | Vertical line |
|
"square" | Square |
|
"diamond" | Diamond |
|
"^" | Upward-pointing triangle |
|
"v" | Downward-pointing triangle |
|
">" | Right-pointing triangle |
|
"<" | Left-pointing triangle |
|
"pentagram" | Pentagram |
|
"hexagram" | Hexagram |
|
| Color Name | Short Name | RGB Triplet | Appearance |
|---|---|---|---|
"red" | "r" | [1 0 0] |
|
"green" | "g" | [0 1 0] |
|
"blue" | "b" | [0 0 1] |
|
"cyan"
| "c" | [0 1 1] |
|
"magenta" | "m" | [1 0 1] |
|
"yellow" | "y" | [1 1 0] |
|
"black" | "k" | [0 0 0] |
|
"white" | "w" | [1 1 1] |
|
Name-Value Arguments
Specify optional pairs of arguments as
Name1=Value1,...,NameN=ValueN, where Name is
the argument name and Value is the corresponding value.
Name-value arguments must appear after other arguments, but the order of the
pairs does not matter.
Before R2021a, use commas to separate each name and value, and enclose
Name in quotes.
Example: 'Marker','o','MarkerFaceColor','red'
Alternatively, you can specify some common colors by name. This table lists the named color options, the equivalent RGB triplets, and the hexadecimal color codes.
| Color Name | Short Name | RGB Triplet | Hexadecimal Color Code | Appearance |
|---|---|---|---|---|
"red" | "r" | [1 0 0] | "#FF0000" |
|
"green" | "g" | [0 1 0] | "#00FF00" |
|
"blue" | "b" | [0 0 1] | "#0000FF" |
|
"cyan"
| "c" | [0 1 1] | "#00FFFF" |
|
"magenta" | "m" | [1 0 1] | "#FF00FF" |
|
"yellow" | "y" | [1 1 0] | "#FFFF00" |
|
"black" | "k" | [0 0 0] | "#000000" |
|
"white" | "w" | [1 1 1] | "#FFFFFF" |
|
"none" | Not applicable | Not applicable | Not applicable | No color |
This table lists the default color palettes for plots in the light and dark themes.
| Palette | Palette Colors |
|---|---|
Before R2025a: Most plots use these colors by default. |
|
|
|
You can get the RGB triplets and hexadecimal color codes for these palettes using the orderedcolors and rgb2hex functions. For example, get the RGB triplets for the "gem" palette and convert them to hexadecimal color codes.
RGB = orderedcolors("gem");
H = rgb2hex(RGB);
Before R2023b: Get the RGB triplets using RGB =
get(groot,"FactoryAxesColorOrder").
Before R2024a: Get the hexadecimal color codes using H =
compose("#%02X%02X%02X",round(RGB*255)).
Example: 'blue'
Example: [0
0 1]
Example: '#0000FF'
Line style, specified as one of the options listed in this table.
| Line Style | Description | Resulting Line |
|---|---|---|
"-" | Solid line |
|
"--" | Dashed line |
|
":" | Dotted line |
|
"-." | Dash-dotted line |
|
"none" | No line | No line |
Marker symbol, specified as one of the values listed in this table. By default, the object does not display markers. Specifying a marker symbol adds markers at each data point or vertex.
| Marker | Description | Resulting Marker |
|---|---|---|
"o" | Circle |
|
"+" | Plus sign |
|
"*" | Asterisk |
|
"." | Point |
|
"x" | Cross |
|
"_" | Horizontal line |
|
"|" | Vertical line |
|
"square" | Square |
|
"diamond" | Diamond |
|
"^" | Upward-pointing triangle |
|
"v" | Downward-pointing triangle |
|
">" | Right-pointing triangle |
|
"<" | Left-pointing triangle |
|
"pentagram" | Pentagram |
|
"hexagram" | Hexagram |
|
"none" | No markers | Not applicable |
Alternatively, you can specify some common colors by name. This table lists the named color options, the equivalent RGB triplets, and the hexadecimal color codes.
| Color Name | Short Name | RGB Triplet | Hexadecimal Color Code | Appearance |
|---|---|---|---|---|
"red" | "r" | [1 0 0] | "#FF0000" |
|
"green" | "g" | [0 1 0] | "#00FF00" |
|
"blue" | "b" | [0 0 1] | "#0000FF" |
|
"cyan"
| "c" | [0 1 1] | "#00FFFF" |
|
"magenta" | "m" | [1 0 1] | "#FF00FF" |
|
"yellow" | "y" | [1 1 0] | "#FFFF00" |
|
"black" | "k" | [0 0 0] | "#000000" |
|
"white" | "w" | [1 1 1] | "#FFFFFF" |
|
"none" | Not applicable | Not applicable | Not applicable | No color |
This table lists the default color palettes for plots in the light and dark themes.
| Palette | Palette Colors |
|---|---|
Before R2025a: Most plots use these colors by default. |
|
|
|
You can get the RGB triplets and hexadecimal color codes for these palettes using the orderedcolors and rgb2hex functions. For example, get the RGB triplets for the "gem" palette and convert them to hexadecimal color codes.
RGB = orderedcolors("gem");
H = rgb2hex(RGB);
Before R2023b: Get the RGB triplets using RGB =
get(groot,"FactoryAxesColorOrder").
Before R2024a: Get the hexadecimal color codes using H =
compose("#%02X%02X%02X",round(RGB*255)).
Example: [0.5 0.5 0.5]
Example: 'blue'
Example: '#D2F9A7'
Alternatively, you can specify some common colors by name. This table lists the named color options, the equivalent RGB triplets, and the hexadecimal color codes.
| Color Name | Short Name | RGB Triplet | Hexadecimal Color Code | Appearance |
|---|---|---|---|---|
"red" | "r" | [1 0 0] | "#FF0000" |
|
"green" | "g" | [0 1 0] | "#00FF00" |
|
"blue" | "b" | [0 0 1] | "#0000FF" |
|
"cyan"
| "c" | [0 1 1] | "#00FFFF" |
|
"magenta" | "m" | [1 0 1] | "#FF00FF" |
|
"yellow" | "y" | [1 1 0] | "#FFFF00" |
|
"black" | "k" | [0 0 0] | "#000000" |
|
"white" | "w" | [1 1 1] | "#FFFFFF" |
|
"none" | Not applicable | Not applicable | Not applicable | No color |
This table lists the default color palettes for plots in the light and dark themes.
| Palette | Palette Colors |
|---|---|
Before R2025a: Most plots use these colors by default. |
|
|
|
You can get the RGB triplets and hexadecimal color codes for these palettes using the orderedcolors and rgb2hex functions. For example, get the RGB triplets for the "gem" palette and convert them to hexadecimal color codes.
RGB = orderedcolors("gem");
H = rgb2hex(RGB);
Before R2023b: Get the RGB triplets using RGB =
get(groot,"FactoryAxesColorOrder").
Before R2024a: Get the hexadecimal color codes using H =
compose("#%02X%02X%02X",round(RGB*255)).
Example: [0.3 0.2 0.1]
Example: "green"
Example: "#D2F9A7"
Output Arguments
Tips
For additional examples, follow the
fsurfpage becausefmeshandfsurfshare the same syntax. All examples on thefsurfpage apply tofmesh.
Algorithms
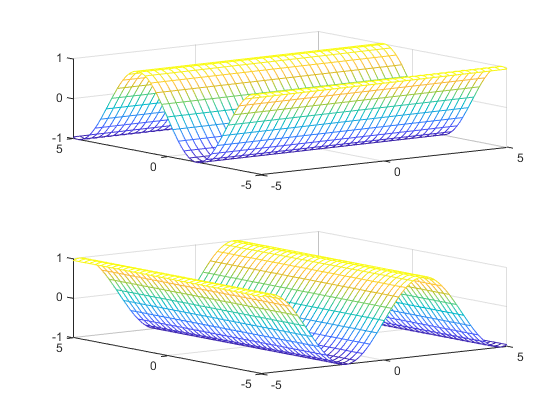
fmesh assigns the symbolic variables
in f to the x-axis, then the y-axis,
and symvar determines the order of the variables to be assigned. Therefore, variable
and axis names might not correspond. To force fmesh to assign
x or y to its corresponding axis, create the symbolic
function to plot, then pass the symbolic function to fmesh.
For example, the following code plots the mesh of f(x,y) = sin(y) in two ways. The first way forces the waves to oscillate with respect to the y-axis. In other words, the first plot assigns the y variable to the corresponding y-axis. The second plot assigns y to the x-axis because it is the first (and only) variable in the symbolic function.
syms x y;
f(x,y) = sin(y);

figure;
subplot(2,1,1)
fmesh(f);
subplot(2,1,2)
fmesh(f(x,y)); % Or fmesh(sin(y));
Version History
Introduced in R2016a