Results for

Dynamic Field Name shaming

We told you "NO!!!"

I climbed the L-Shaped Peak

Choose your weapon

ChatGPT has Fallen.

MATLAB vs. Python

Caution. This is MATLAB.

MATLAB is the best programming language


I love the smell of debugged MATLAB code in the morning. Smells like...Victory!
Halloween Analysis of Many Aspects of Halloween Headquarters and Effects on USA
(Note to Chistopher: I used a simple ESP8266 generating random numbers for fields 1 thru 7, (0 to 100, 4000, 127, 30, 45, 200,000, 50,000) and 0 to 1 for field 8. And a couple of real sensor inputs.
Hello all,
I've been trying to shift my workflow more towards simbiology, it has a lot of very interesting features and it makes sense to try and do everything in one place if it works well..! Part of my hesitancy into this was some bad experiences handling units in the past, though this was almost certainly all out of my own ignorance, relatedly:
Getting onto my question.
In this model I have a species traveling around the body via blow flow, think a basic PBPK model. My species are picomolarities, if everything is already in concentrations, why is it necessary to initially divide by the compartment volume? i.e. 1/Pancreas below.

If my model dealt in molar quantities this would make a lot of sense, the division would represent the transition to concentrations. This, however, now necessitates my parameters be in units of liter/minute, which is actually correct, but I'd like clarification on why it's correct, ha!
Perhaps this is more of a modelling question than a simbiology question, but if there are answers I'd love to hear them. Thanks!
I'm in a community conference in Boston today and see what snacks we get! The organizer said it's a coincidence, but it's definitly a good idea to have them in our MathWorks community meetings.


(Sorry - it should be 2023b by now.)
spy
To solve the puzzle, first unscramble each of the words on the left. Then rearrange the letters in the yellow shaded boxes to complete the sentence on the right.
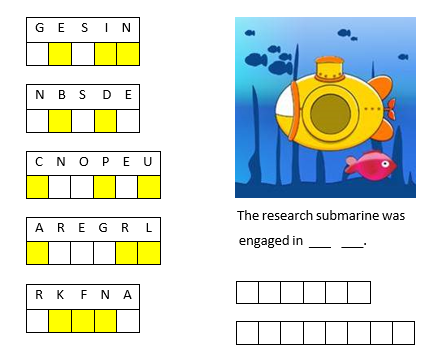
If you enjoyed this puzzle let me know with a like or in the comments below and I'll post more of them. Please don't post your answer, or any hints, and spoil it for those who come across this puzzle after you!! If you want to check your answer, you can messge me your guess through the link on my profile card (click on my name, Rena Berman, above and then on the envelope icon in the top right corner of the profile card that appears).
Hi All,
I'm attempting to put a set of simbiology global sensitivity analysis plots into my thesis and I'm running into some issues with the GSA plots. Firstly, the figures are very large, it would be quite beneficial to grab a set of the plots and arrange them myself, is there any documentation on how to mess around with the '1x1 Sobol' produced by sbiosobol? Or just GSA plots in general.
The second problem is that the results appear to be relative to the most sensitive parameter in that run. Is it recommended to have a resonably sensitive 'baseline' parameter in each run? I find it difficult to compare plots when a not so sensitive parameter is being recorded as near '1' for the whole run because it's being stacked against a set of very insensitive parameters. I.e. if i have multiple sets of GSAs due to a large model, how can I easily compare results? If I could do some single run through with every parameter that would be the ideal, I imagine, but then the default plot would be half a mile off the bottom of my screen, haha! Perhaps there is a solution to the first question that might help there?
Thank you for your help,
Dan
Thats the task:
Given a square cell array:
x = {'01', '56'; '234', '789'};
return a single character array:
y = '0123456789'
I wrote a code that passes Test 1 and 2 and one that passes Test 3 but I'm searching a condition so that the code for Test 3 runs when the cell array only contains letters and the one for Test 1 and 2 in every other case. Can somebody help me?
This is my code:
y = []
[a,b]=size(x)
%%TEST 3
delimiter=zeros(1,a)
delimiter(end)=1
delimiter=repmat(delimiter,1,b)
delimiter(end)=''
delimiter=string(delimiter)
y=[]
for i=1:a*b
y = string([y x(i)])
end
y=join(y,delimiter)
y=erase(y,'0')
y=regexprep(y,'1',' ')
%%TEST 1+2
for i=1:a*b
y = string([y x(i)])
y=join(y)
end
y=erase(y,' ' )
That's the question: Given four different positive numbers, a, b, c and d, provided in increasing order: a < b < c < d, find if any three of them comprise sides of a right-angled triangle. Return true if they do, otherwise return false .
I wrote this code but it doesn't pass test 7. I don't really understand why it isn't working. Can somebody help me?
function flag = isTherePythagoreanTriple(a, b, c, d)
a2=a^2
b2=b^2
c2=c^2
d2=d^2
format shortG
if a2+b2==c2
flag=true
else if a2+b2==d2
flag=true
else if a2+c2==d2
flag=true
else if c2+b2==d2
flag=true
else flag=false
end
end
end
end
end
That's the question:
The file cars.mat contains a table named cars with variables Model, MPG, Horsepower, Weight, and Acceleration for several classic cars.
Load the MAT-file. Given an integer N, calculate the output variable mpg.
Output mpg should contain the MPG of the top N lightest cars (by Weight) in a column vector.
I wrote this code and the resulting column vector has the right values but it doesn't pass the tests. What's wrong?
function mpg = sort_cars(N)
load cars.mat
sorted=sortrows(cars,4)
mpg = sorted(1:N,2)
end