Results for
Hi All,
I'm currently attempting to implement a Hodgkin-Huxley-type model of membrane potential, ideally I would like a species that represents the membrane potential as its own distinct entity, so as the reference elsewhere. I've currently established a molarity-based work around but it would be great if I could set the units for the species as millivolt, but that throws an error.
Is there an established way to do this? I imagine I'm not the first person to be trying to model a voltage-gated ion channel!
Thank you for your help.

Share your fun photos in the comments!
Here's a MATLAB class I wrote that leverages the MATLAB Central Interface for MATLAB toolbox, which in turn uses the publicy available Community API. Using this class, I've created a few Favorites that show me what's going on in MATLAB Central - without having to leave MATLAB 🙂
The class has a few convenient queries:
- Results for the last 7 days
- Results for the last 30 days
- Results for the current month
- Results for today
And supporting a bunch of different content scopes:
- All MATLAB Central
- MATLAB Answers
- Blogs
- Cody
- Contests
- File Exchange
- Exclude Answers content
The results are displayed in the command window (which worked best for me) and link to each post. Here's what that looks like for this command
>> CommunityFeed.thisMonth("app designer", CommunityFeed.Scope.ExcludeAnswers)
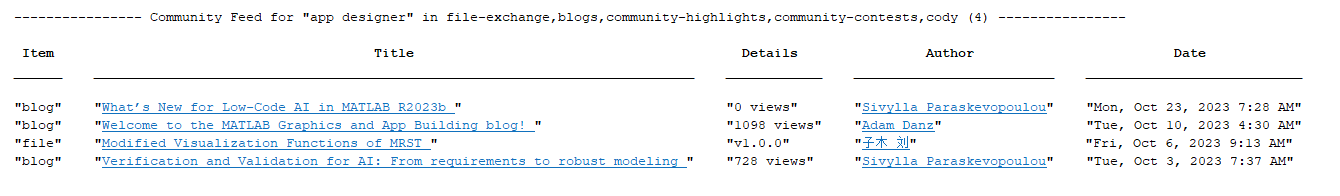
Let me know if you find this class useful and feel free to suggest changes.
Hello,
I've looked around and I haven't found anything obvious about this, but is it possible to link to species/reactions, graphically, in a non-mass transfer sense? I have areas in my model where it would conceptually make sense to be able to see that species or reactions are linked, but if I link them in the standard way it demands that it be involved in the stoichiometry.
Perhaps some kind of dotted line, or similar?
Thank you, best regards,
Dan
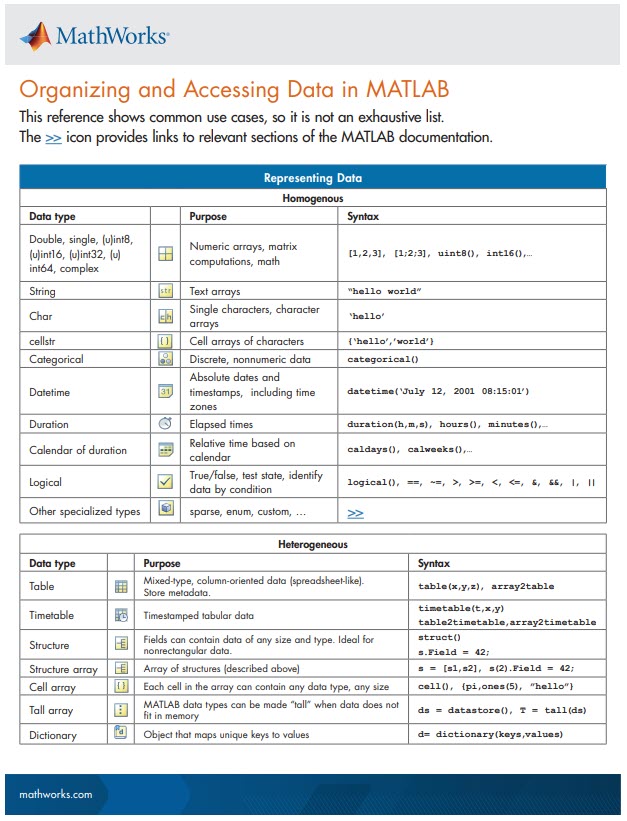
New Cheat Sheet Alert!
Level up your data organization and access skills in MATLAB with our latest cheat sheet! Download the full cheat sheet on MATLAB GitHub for Students here.
I know the latest version of MATLAB R2023b has this feature already, put it should be added to R2023a as well because of its simplicity and convenience.
Basically, I want to make a bar graph that lets me name each column in a basic bar graph:
y=[100 99 100 200 200 300 500 800 1000];
x=["0-4" "5-17" "18-29" "30-39" "40-49" "50-64" "65-74" "75-84" "85+"];
bar(x,y)
However, in R2023a, this isn't a feature. I think it should be added because it helps to present data and ideas more clearly and professionally, which is the purpose of a graph to begin with.
Would it be a good thing to have implicit expansion enabled for cat(), horzcat(), vertcat()? There are often situations where I would like to be able to do things like this:
x=[10;20;30;40];
y=[11;12;13;14];
z=cat(3, 0,1,2);
C=[x,y,z]
with the result,
C(:,:,1) =
10 11 0
20 12 0
30 13 0
40 14 0
C(:,:,2) =
10 11 1
20 12 1
30 13 1
40 14 1
C(:,:,3) =
10 11 2
20 12 2
30 13 2
40 14 2


Wait for Walter, the rest of us are mere users.

MATLAB Training

MATLAB Training

Mathworks tech support

Stand Back. I'm going to try MATLAB.

Embarassed by Walter Roberson

I use MATLAB.

MATLAB Reloaded

MATLAB Men


MATLAB rule!

So true.