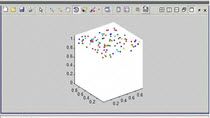
Making a Sweeping Slice Through Volume of Data
(Originally posted on Doug's MATLAB Video Tutorials blog.)
A MATLAB user recently asked how we could make a visualization similar to this one.
I was a little surprised that we were able to do the visualization, with interactivity in less that 15 lines of code.
d = flow; d = shiftdim(d,2);
x = 25;
y = 26;
z = 21.59561;
v = 3.22068;
h = slice(d,x,y,z)
d(:,:,z:end) = nan;
isosurface(d,-v)
set(h,'edgeColor','none')
axis equal
zlim([0 size(d,3)])
colormap spring
This video makes use of cell mode to get the interactivity. You can see how something like this could be done with a GUI to get the interactivity that you might want.
If you like this kind of thing, Slice-o-matic, will be good for you.
Recorded: 11 Dec 2009
Featured Product
MATLAB
Up Next:
Related Videos:
Sélectionner un site web
Choisissez un site web pour accéder au contenu traduit dans votre langue (lorsqu'il est disponible) et voir les événements et les offres locales. D’après votre position, nous vous recommandons de sélectionner la région suivante : .
Vous pouvez également sélectionner un site web dans la liste suivante :
Comment optimiser les performances du site
Pour optimiser les performances du site, sélectionnez la région Chine (en chinois ou en anglais). Les sites de MathWorks pour les autres pays ne sont pas optimisés pour les visites provenant de votre région.
Amériques
- América Latina (Español)
- Canada (English)
- United States (English)
Europe
- Belgium (English)
- Denmark (English)
- Deutschland (Deutsch)
- España (Español)
- Finland (English)
- France (Français)
- Ireland (English)
- Italia (Italiano)
- Luxembourg (English)
- Netherlands (English)
- Norway (English)
- Österreich (Deutsch)
- Portugal (English)
- Sweden (English)
- Switzerland
- United Kingdom (English)
Asie-Pacifique
- Australia (English)
- India (English)
- New Zealand (English)
- 中国
- 日本Japanese (日本語)
- 한국Korean (한국어)