Main Content

TriScatteredInterp

(Not recommended) Interpolate scattered data

TriScatteredInterp is not recommended. Use scatteredInterpolant instead.

Description

TriScatteredInterp is used to perform interpolation on a scattered dataset that resides in 2-D or 3-D space. A scattered data set defined by locations X and corresponding values V can be interpolated using a Delaunay triangulation of X. This produces a surface of the form V = F(X). The surface can be evaluated at any query location QX, using QV = F(QX), where QX lies within the convex hull of X. The interpolant F always goes through the data points specified by the sample.

Creation

Description

F = TriScatteredInterp creates an empty scattered data interpolant.

F = TriScatteredInterp(Q,V) creates an interpolant that fits a surface of the form V = F(Q) to the scattered data in (Q, V). Q is a matrix of size mpts-by-ndim, where mpts is the number of points and ndim is the dimension of the space where the points reside (ndim is 2 or 3). The column vector V defines the values at Q, where the length of V equals mpts.

F = TriScatteredInterp(X,Y,V) and F = TriScatteredInterp(X,Y,Z,V) specifies the data point locations in alternative column vector format when working in 2-D and 3-D.

example

F = TriScatteredInterp(DT,V) uses the specified DelaunayTri object DT as a basis for computing the interpolant. DT is a Delaunay triangulation of the scattered data locations, DT.X. The matrix DT.X is of size mpts-by-ndim, where mpts is the number of points and ndim is the dimension of the space where the points reside, 2 <= ndim <= 3. V is a column vector that defines the values at DT.X, where the length of V equals mpts.

F = TriScatteredInterp(___,method) specifies the interpolation technique method used to interpolate the data. You can use any of the previous input argument combinations.

Input Arguments

expand all

Scattered data points, specified as a matrix. Q is of size mpts-by-ndim, where mpts is the number of points and ndim is the dimension of the space where the points reside.

Scattered data points, specified as separate column vectors. Specify (X, Y) for 2-D data or (X, Y, Z) for 3-D data.

Sample point values, specified as a column vector. V defines the values at the sample data points, where the length of V equals mpts.

Delaunay triangulation representation, specified as a DelaunayTri object.

Interpolation method, specified as one of these values:

ValueDescription
linearLinear interpolation (default)
naturalNatural neighbor interpolation
nearestNearest neighbor interpolation

Properties

expand all

Scattered data points, specified as a matrix. The dimension of X is mpts-by-ndim, where mpts is the number of data points and ndim is the dimension of the space where the points reside (2 <= ndim <= 3).

If column vectors of X, Y or X,Y,Z coordinates are used to construct the interpolant, then the data is consolidated into a single matrix X.

Sample point values, specified as a column vector. V is a vector of length mpts, where mpts is the number of scattered data points.

Interpolation method, specified as one of these values:

ValueDescription
linearLinear interpolation (default)
naturalNatural neighbor interpolation
nearestNearest neighbor interpolation

Object Functions

To evaluate the interpolant, express the statement in Monge's form Vq = F(Xq), Vq = F(Xq,Yq), or Vq = F(Xq,Yq,Zq) where Vq is the value of the interpolant at the query location and Xq, Yq, and Zq are the vectors of point locations.

Examples

collapse all

Create a data set of 2-D random, scattered points.

rng default
x = rand(100,1)*4-2;
y = rand(100,1)*4-2;
z = x.*exp(-x.^2-y.^2);

Construct an interpolant for the data.

F = TriScatteredInterp(x,y,z);

Evaluate the interpolant at query point locations (qx,qy). The corresponding interpolated values at these locations are returned in qz.

ti = -2:.15:2;
[qx,qy] = meshgrid(ti,ti);
qz = F(qx,qy);

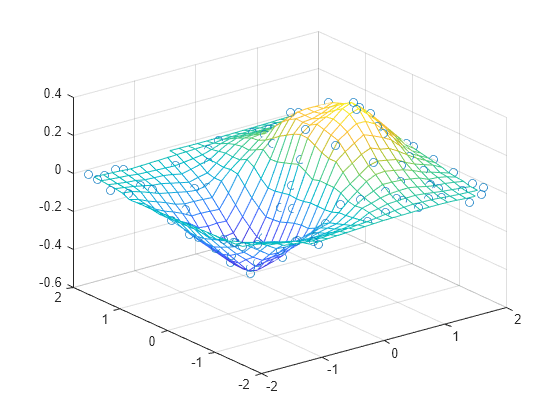
Plot the data and interpolated surface.

mesh(qx,qy,qz)
hold on
plot3(x,y,z,'o')

Figure contains an axes object. The axes object contains 2 objects of type surface, line. One or more of the lines displays its values using only markers

More About

expand all

Extended Capabilities

Version History

Introduced in R2009a

Go to top of page