Main Content

midcross

Mid-reference level crossing for bilevel waveform

Description

example

c = midcross(x) returns the time instants where each transition of the input signal x crosses the 50% reference level. To determine the transitions, the midcross function estimates the state levels of x by a histogram method and identifies all intervals which cross the upper-state boundary of the low state and the lower-state boundary of the high state.

example

c = midcross(x,Fs) specifies the sample rate Fs.

example

c = midcross(x,t) specifies the sample instants t.

example

[c,midlev] = midcross(___) returns the waveform value corresponding to the mid-reference level. You can specify an input combination from any of the previous syntaxes.

example

c = midcross(x,Name,Value) returns the time instants corresponding to mid-reference level crossings with additional options specified by one or more name-value arguments.

example

midcross(___) plots the signal and marks the location of the mid-crossings (mid-reference level instants) and the associated reference levels. The function also plots the state levels with upper and lower state boundaries.

Examples

collapse all

Assuming a sampling interval of 1, compute the mid-reference level instant of a bilevel waveform. Plot the result.

load('transitionex.mat','x')

midcross(x)

ans = 21.5000

The instant at which the waveform crosses the 50% reference level is 21.5. This is not a sampling instant present in the input vector. midcross uses interpolation to identify the mid-reference level crossing.

Compute the mid-reference level instant for a sampled bilevel waveform. Use the time information to determine the sample rate, which is 4 MHz.

load('transitionex.mat','x','t')
Fs = 1/(t(2)-t(1))
Fs = 4000000

Use the sample rate to express the mid-reference level instant in seconds. Plot the waveform and annotate the result.

midcross(x,Fs)

ans = 5.1250e-06

Compute the mid-reference level instant using a vector of sample times equal in length to the bilevel waveform. The sample rate is 4 MHz.

load('transitionex.mat','x','t')

C = midcross(x,t)
C = 5.1250e-06

Annotate the result on a plot of the waveform.

midcross(x,t);

Compute the level corresponding to the mid-reference level instant.

load('transitionex.mat','x','t')

[~,midlev] = midcross(x,t)
midlev = 1.1388

Annotate the result on a plot of the waveform.

midcross(x,t);

Obtain the 60% reference level instant and value for a bilevel waveform sampled at 4 MHz.

load("transitionex.mat","x","t")

[mc,Lev60] = midcross(x,t,MidPercentReferenceLevel=60)
mc = 5.1473e-06
Lev60 = 1.3682

Annotate the result on a plot of the waveform.

midcross(x,t,MidPercentReferenceLevel=60);

Input Arguments

collapse all

Bilevel waveform, specified as a real-valued vector. The first sample instant corresponds to t=0.

Sample rate, specified as a positive real scalar in hertz.

Sample instants, specified as a vector. The length of t must equal the length of the input bilevel waveform x. The sample instants correspond to the indices of the input vector.

Name-Value Arguments

Specify optional pairs of arguments as Name1=Value1,...,NameN=ValueN, where Name is the argument name and Value is the corresponding value. Name-value arguments must appear after other arguments, but the order of the pairs does not matter.

Example: c = midcross(x,t,MidPercentReferenceLevel=30)

Before R2021a, use commas to separate each name and value, and enclose Name in quotes.

Example: c = midcross(x,t,'MidPercentReferenceLevel',30)

Mid-reference level as a percentage of the waveform amplitude, specified as a scalar. For more information, see Mid-Reference Level.

Low- and high-state levels, specified as a 1-by-2 real-valued vector. The first element is the low-state level and the second element is the high-state level. If you do not specify 'StateLevels', the function estimates the state levels from the input waveform using the histogram method.

Tolerance levels (lower- and upper-state boundaries), specified as a scalar and expressed as a percentage. The low-state and high-state boundaries are expressed as the state level plus or minus a multiple of the difference between the state levels. For more information, see State-Level Tolerances.

Output Arguments

collapse all

Time instants of the mid-reference level crossings, returned as a vector.

Note

Because midcross uses interpolation to determine the crossing instant, c may contain values that do not correspond to sampling instants.

Mid-reference level, returned as a scalar.

More About

collapse all

Mid-Reference Level

The mid-reference level in a bilevel waveform with low-state level S1 and high–state level S2 is

S1+12(S2S1)

Mid Reference Level Instant

  • Let y50% denote the mid–reference level.

  • Let t50%- and t50%+ denote the two consecutive sampling instants corresponding to the waveform values nearest in value to y50%.

  • Let y50%- and y50%+ denote the waveform values at t50%- and t50%+.

The mid-reference level instant is

t50%=t50%+(t50%+t50%y50%+y50%)(y50%+y50%)

State-Level Tolerances

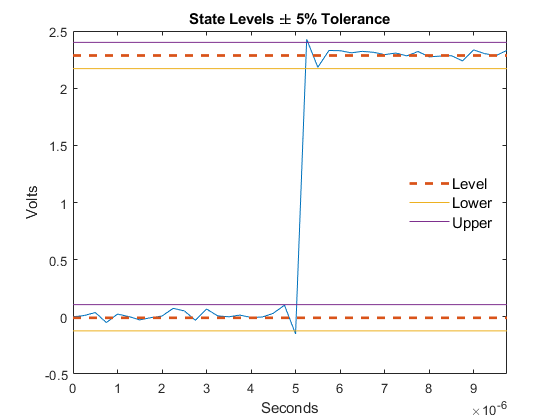
You can specify lower- and upper-state boundaries for each state level. Define the boundaries as the state level plus or minus a scalar multiple of the difference between the high state and the low state. To provide a useful tolerance region, specify the scalar as a small number such as 2/100 or 3/100. In general, the $\alpha\%$ region for the low state is defined as

$$S_1\pm{\alpha\over{100}}(S_2-S_1),$$

where $S_1$ is the low-state level and $S_2$ is the high-state level. Replace the first term in the equation with $S_2$ to obtain the $\alpha\%$ tolerance region for the high state.

This figure shows lower and upper 5% state boundaries (tolerance regions) for a positive-polarity bilevel waveform. The thick dashed lines indicate the estimated state levels.

References

[1] IEEE® Standard on Transitions, Pulses, and Related Waveforms, IEEE Standard 181, 2003. p. 20.

Extended Capabilities

C/C++ Code Generation
Generate C and C++ code using MATLAB® Coder™.

Version History

Introduced in R2012a