Model a Finite State Machine
A finite state machine represents event-driven, reactive systems that transition between operating modes when specific conditions are met. For example, you can the model the transmission of a car that shifts between gears as you accelerate. Because a finite state machine can represent systems that have multiple states and transmissions, they are common in fields like software engineering, robots, and telecommunications. You can model a finite state machine by using the states, transitions, and data in Stateflow®.
For example, in this simple Stateflow chart, a car transmission transitions from one gear state to another.
In software development, you can use a finite state machine to manage user interfaces, protocol design, and workflow automation. In robotics, finite state machines control robot behavior, enabling seamless transitions between tasks such as navigation, obstacle avoidance, and object manipulation. In telecommunications, you model communication protocols and network operations. You can use Stateflow to design, simulate, and troubleshoot the performance of finite state machines in various domains.
Types of Stateflow Blocks
To represent the relationships between the inputs, outputs, and operating modes of a finite state machine, you can use these Stateflow blocks to create state transition diagrams, state transition tables, and truth tables.
Stateflow Block | Use Case |
|---|---|
| Chart | Graphical representation of a finite state machine. Inside a Stateflow chart, you use states and transitions to build a sequential logic system. States correspond to operating modes and transitions represent pathways between states. For more information, see Represent Operating Modes by Using States and Transition Between Operating Modes. |
| State Transition Table | Tabular representation of a finite state machine for sequential modal logic. Use a State Transition Table block to model a state machine in a compact format that requires minimal maintenance of graphical objects. For more information, see Model Finite State Machines Using State Transition Tables. |
| Truth Table | Tabular representation of combinatorial logic design. You can use Truth Table blocks to model decision making for fault detection and management and mode switching. For more information, see Use Truth Tables to Model Combinatorial Logic. |
Implement Stateflow Blocks
To create a Stateflow chart that models a finite state machine, follow these steps:
Start MATLAB®. In the MATLAB Toolstrip, in the Home tab, click Simulink.
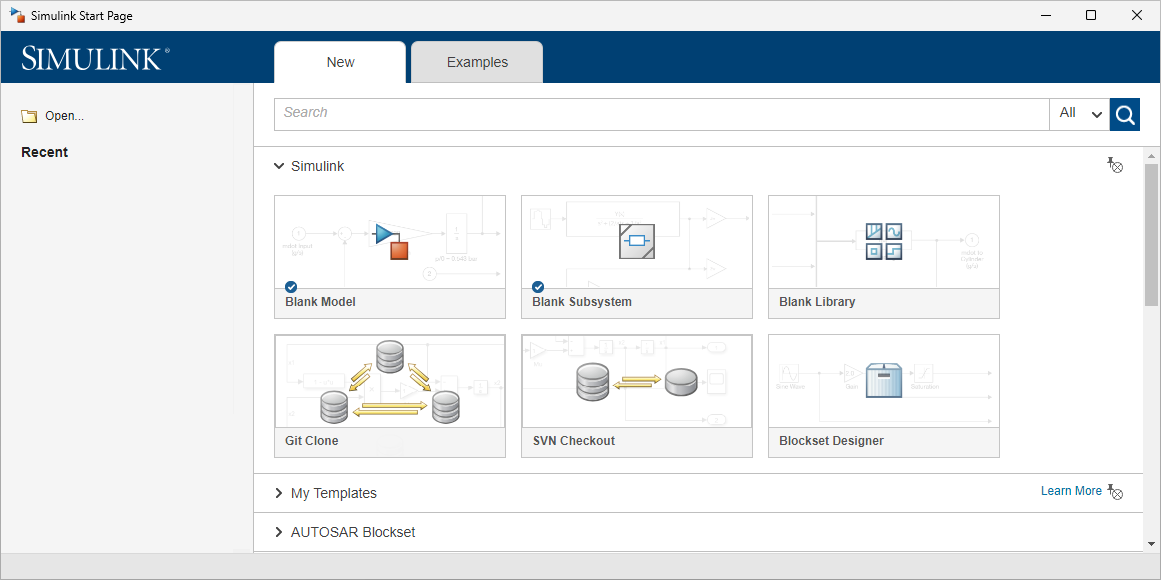
On the start page, in the Stateflow section, click the Blank Chart template. Open the Stateflow Editor by double-clicking the Chart block.
For each operating mode in your system, draw a state and implement actions by adding state labels.
Draw transitions to represent the flow logic direction between states, and add transition labels to implement the transition conditions. Use a default transition to mark the first active state.
If your system has inputs or outputs or depends on any state variables, add input, output, and local data. For more information, see Add Stateflow Data.
If your system reacts to event triggers or must trigger actions in your chart or other blocks in your model, add input, output, or local events. For more information, see Use Events to Execute Charts.
If your chart has complex state actions or transition conditions, you can add reusable functions. You can select from graphical functions, MATLAB functions, Simulink functions, or truth tables. Alternatively, you can write your own C or C++ code to integrate with your chart. For more information, see Reuse MATLAB Code by Defining MATLAB Functions and Call Simulink Functions in States and Transitions.
Connect the chart to other blocks in the Simulink model using input and output ports.
Click Run
 to simulate the model. The Stateflow Editor animates the chart
during simulation by highlighting the active states and transitions.
to simulate the model. The Stateflow Editor animates the chart
during simulation by highlighting the active states and transitions.
Stateflow charts and State Transition Table blocks can use either MATLAB or C as the action language. Truth Table blocks only use MATLAB as the action language. For more information, see Differences Between MATLAB and C as Action Language Syntax.
For a tutorial that illustrates how to create a Stateflow chart, see Create Stateflow Charts.
References
[1] Harel, David. "Statecharts: A Visual Formalism for Complex Systems." Science of Computer Programming 8, no.3 (June 1987): 231-74.
[2] Hatley, Derek J. and Imtiaz A. Pirbhai. Strategies for Real-Time System Specification. New York, NY: Dorset House Publishing, 1988.