Hyperspectral Image Processing
Hyperspectral Imaging Library for Image Processing Toolbox™ provides MATLAB® functions and tools for hyperspectral and multispectral image processing and visualization.
Use the functions in this library to read, write, and process data captured by using the hyperspectral and multispectral imaging sensors in a variety of file formats. The library supports national imagery transmission format (NITF), environment for visualizing images (ENVI), tagged image file format (TIFF), metadata text extension (MTL), hierarchical data format (HDF), and standard archive format for Europe (SAFE) file formats.
The library presents a set of algorithms for band selection, denoising, radiometric and atmospheric correction, dimensionality reduction, endmember extraction, abundance map estimation, spectral matching, anomaly detection, computing spectral indices, and segmentation.
The Hyperspectral Viewer app enables you to read hyperspectral and multispectral data, display metadata and geospatial information, visualize individual band images and their histograms, create a spectrum plot for a pixel or region in a data cube, plot endmembers, generate different color or false-color representations, compute spectral indices, and export results.
To perform hyperspectral and multispectral image analysis, download the Hyperspectral Imaging Library for Image Processing Toolbox from the Add-On Explorer. For more information on downloading add-ons, see Get and Manage Add-Ons.
Apps
| Hyperspectral Viewer | Visualize hyperspectral and multispectral data |
| Spectral Image Labeler | Label hyperspectral and multispectral images (Since R2026a) |
Functions
Topics
Get Started
- Get Started with Hyperspectral and Multispectral Image Processing
Basics of hyperspectral and multispectral image processing. - Analyze Hyperspectral and Multispectral Images
Describes approaches to hyperspectral and multispectral imaging. - Explore Hyperspectral and Multispectral Data in the Hyperspectral Viewer
This example shows how to explore hyperspectral and multispectral data using the Hyperspectral Viewer app. - Get Started with Spectral Image Labeler
Interactively label hyperspectral and multispectral images. - Process Large Hyperspectral and Multispectral Images
This example shows how to process small regions of large hyperspectral and multispectral images. - Hyperspectral and Multispectral Data Correction
Describes radiometric calibration, atmospheric correction, and spectral correction. - Spectral Matching and Target Detection Techniques
Techniques for target detection and spectral matching. - Spectral Indices
Describes spectral indices. - Support for Singleton Dimensions
Analysis of 1-D and 2-D spectral data using singleton hypercube.
Classification
- Classify Hyperspectral Image Using Library Signatures and SAM
Classify pixels in a hyperspectral image by using the spectral angle mapper (SAM) classification algorithm. - Classify Hyperspectral Images Using Deep Learning
This example shows how to perform hyperspectral image classification using a custom spectral convolution neural network (CSCNN). - Classify Hyperspectral Image Using Support Vector Machine Classifier
This example shows how to perform hyperspectral image classification using a support vector machine (SVM) classifier.
Region Identification
- Target Detection Using Spectral Signature Matching
Detect a known target in the hyperspectral image by using the spectral matching method. - Identify Vegetation Regions Using Interactive NDVI Thresholding
Identify the types of vegetations regions in a hyperspectral image through interactive thresholding of a normalized difference vegetation index (NDVI) map. - Find Regions in Spatially Referenced Multispectral Image
This example shows how to identify water and vegetation regions in a Landsat 8 multispectral image and spatially reference the image.
Digital Twin
- Generate RoadRunner Scene Using Aerial Hyperspectral and Lidar Data (Automated Driving Toolbox)
Generate RoadRunner scene from aerial hyperspectral and lidar data.
Segmentation
- Segment Hyperspectral Image Using Segment Anything Model in Spectral Image Labeler
This example shows how to write a custom automation algorithm for segmenting hyperspectral images and use it in the Spectral Image Labeler app. - Interactively Segment Hyperspectral Image Using Segment Anything Model
This example shows how to interactively preprocess and segment a hyperspectral image using the Segment Anything Model (SAM). (Since R2025a)
Featured Examples
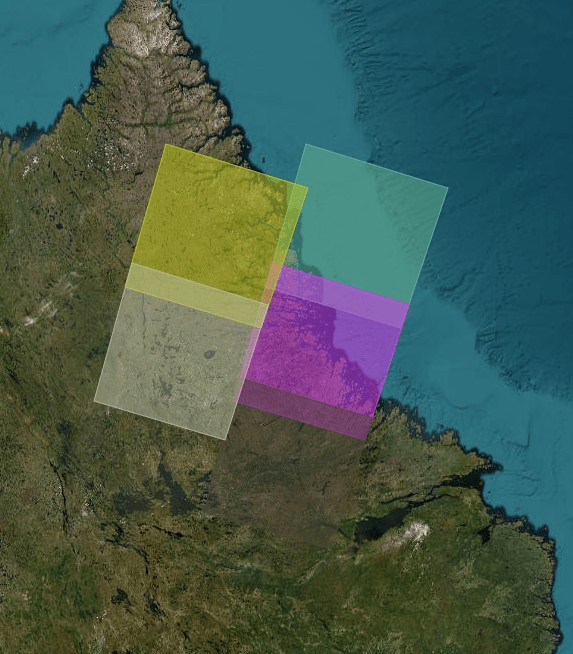
Combine Landsat 9 Multispectral Images Using Image Mosaicing
Stitch multiple Landsat 9 multispectral images into a mosaic image and analyze the mosaic image.

Predict Sugar Content in Grape Berries Using PLS Regression on Hyperspectral Data
Perform non-destructive testing (NDT) using hyperspectral data to predict sugar content in grape berries.

Classify Land Cover Using Hyperspectral and Lidar Data
Classify land cover using a fusion of hyperspectral and lidar data.

Segment Spleen in Hyperspectral Image of Porcine Tissue
Segment a spleen in a hyperspectral image of porcine tissue.

Classify Land Cover Using Sentinel-2 Multispectral Images
Fine-tune a pretrained segmentation model backbone, using Sentinel-2 Level 2A multispectral images and CORINE Land Cover 2018 data, for pixel-level land-cover classification.

Ship Detection from Sentinel-1 C Band SAR Data Using YOLOX Object Detection
Detect ships from Sentinel-1 C Band SAR Data using YOLOX object detection.

Map Flood Areas Using Sentinel-1 SAR Imagery
Map flooded areas using Sentinel-1 Synthetic Aperture Radar (SAR) images.

Change Detection in Hyperspectral Images
Detect changes in land cover from hyperspectral images taken at different times.

Manually Label ROIs in Multispectral Image
Manually select regions of interest (ROIs) from a multispectral image and save them in a shapefile.

Hyperspectral Image Analysis Using Maximum Abundance Classification
Identify different regions in a hyperspectral image by performing maximum abundance classification (MAC). An abundance map characterizes the distribution of an endmember across a hyperspectral image. Each pixel in the image is either a pure pixel or a mixed pixel. The set of abundance values obtained for each pixel represents the percentage of each endmembers present in that pixel. In this example, you will classify the pixels in a hyperspectral image by finding the maximum abundance value for each pixel and assigning it to the associated endmember class.

Endmember Material Identification Using Spectral Library
Identify the classes of endmember materials present in a hyperspectral image.

Automate Pixel Labeling of Hyperspectral Images Using Image Labeler
Load hyperspectral images into the Image Labeler and automatically label pixels.