Descriptive Statistics and Insights
Summarize data using descriptive statistics and regression models
Descriptive statistics quantitatively describe features of a data set. You can interpret and summarize your data using descriptive statistics such as mean, median, standard deviation, and percentiles. You can also assess the relationships between variables by analyzing correlations and fitting regression models.
Functions
Topics
Statistics
- Compute Mean, Median, and Other Descriptive Statistics
Summarize data by computing one or more simple descriptive statistics. - Compare Global, Moving, and Cumulative Statistics
Get data insights by computing and visualizing global, moving, and cumulative statistics. - Explore Basic Statistics on 2-D Plot
Interactively summarize data by computing, visualizing, and saving descriptive statistics for 2-D plotted data using the Data Statistics tool.
Regression and Prediction
- Linear Correlation
Covariance and correlation coefficients help to describe the linear relationship between variables. - Linear Regression with One Predictor Variable
Fit and evaluate a first-order and a second-order linear regression model for one predictor variable and one response variable usingpolyfitandpolyval. - Linear Regression with Nonpolynomial Terms
Fit a nonpolynomial linear regression model for one predictor variable and one response variable by constructing a design matrix and using the backslash operator (\). - Linear Regression with Multiple Predictor Variables
Fit a polynomial linear regression model for multiple predictor variables and one response variable by constructing a design matrix and using the backslash operator (\). - Interactively Fit Data and Visualize Model
Interactively fit and validate polynomial regression models for 2-D plotted data by using the Basic Fitting tool. Then, use the models to interpolate and extrapolate the data.
Featured Examples
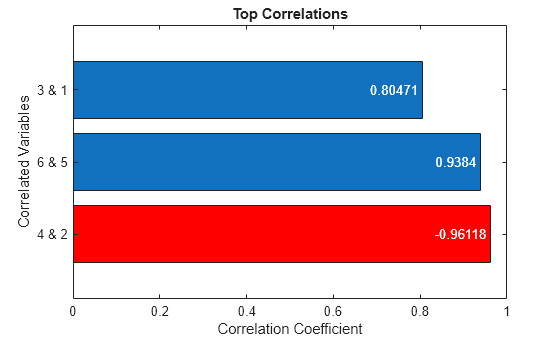
Identify and Visualize Correlated Variables
Calculate, filter, rank, and visualize correlations between variables.